Avnet 2015 Annual Report Download - page 21
Download and view the complete annual report
Please find page 21 of the 2015 Avnet annual report below. You can navigate through the pages in the report by either clicking on the pages listed below, or by using the keyword search tool below to find specific information within the annual report.-
 1
1 -
2
-
3
-
4
-
5
-
6
-
7
-
8
-
9
-
10
-
 11
11 -
 12
12 -
 13
13 -
 14
14 -
 15
15 -
 16
16 -
 17
17 -
 18
18 -
 19
19 -
 20
20 -
 21
21 -
 22
22 -
 23
23 -
 24
24 -
 25
25 -
 26
26 -
 27
27 -
 28
28 -
 29
29 -
 30
30 -
 31
31 -
32
-
33
-
34
-
35
-
36
-
37
-
38
-
39
-
40
-
41
-
42
-
43
-
44
-
45
-
46
-
47
-
48
-
49
-
50
-
51
-
52
-
53
-
54
-
55
-
56
-
57
-
58
-
59
-
60
-
61
-
62
-
63
-
64
-
65
-
66
-
67
-
68
-
69
-
70
-
71
-
72
-
73
-
74
-
75
-
76
-
77
-
78
-
79
-
80
-
81
-
82
-
83
-
84
-
85
-
86
-
87
-
88
-
89
-
90
-
91
-
92
-
93
-
94
-
95
-
96
-
97
 |
 |

TableofContents
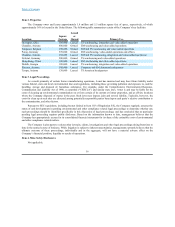
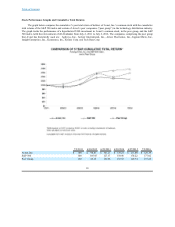
Item 6. Selected Financial Data
Years Ended
July 2, June 27, June 28, June 29, June 30,
2016 2015 2014 2013 2012
(Millions, except for per share and ratio data)
Income:
Sales $ 26,219.3 $ 27,924.7 $ 27,499.7 $ 25,458.9 $ 25,707.5
Grossprofit 3,037.5 3,193.1 3,225.7 2,979.8 3,050.6
Operatingincome 787.7 827.7 789.9 626.0 884.2
Incometaxexpense 164.0 141.1 155.5 99.2 223.8
Netincome 506.5 571.9 545.6 450.1 567.0
FinancialPosition:
Workingcapital 4,061.5 4,312.6 3,907.6 3,443.0 3,335.4
Totalassets 11,239.8 10,800.0 11,255.5 10,474.7 10,167.9
Long-termdebt 1,339.2 1,646.5 1,213.8 1,207.0 1,272.0
Shareholders’equity 4,691.3 4,685.0 4,890.2 4,289.1 3,905.7
PerShare:
Basicearnings 3.87 4.18 3.95 3.26 3.85
Dilutedearnings 3.80 4.12 3.89 3.21 3.79
Cashdividendsdeclared 0.68 0.64 0.60 — —
Bookvalueperdilutedshare 35.2 33.8 34.90 30.64 26.12
Ratios:
Operatingincomeasapercentageofsales 3.0 % 3.0 % 2.9 % 2.5 % 3.4 %
Netincomeasapercentageofsales 1.9 % 2.0 % 2.0 % 1.8 % 2.2 %
Returnoncapital 10.7 % 11.6 % 11.4 % 10.6 % 12.9 %
Quickratio 1.2:1 1.4:1 1.2:1 1.2:1 1.2:1
Currentratio 1.8:1 2.0:1 1.8:1 1.7:1 1.7:1
Totaldebttocapital 34.7 % 29.7 % 29.8 % 32.3 % 35.4 %
(a) Fiscal2016contained53weekscomparedto52weeksintheotherfiscalyearspresented.
(b) All fiscal years presented include restructuring, integration and other expenses, which totaled $79.3 million before tax,
$52.3millionaftertaxand$0.39pershareonadilutedbasisinfiscal2016,$90.8millionbeforetax,$65.9millionaftertax
and$0.47pershareonadilutedbasisinfiscal2015,$94.6millionbeforetax,$70.8millionaftertaxand$0.50pershareon
adilutedbasisinfiscal2014,$149.5millionbeforetax,$116.4millionaftertaxand$0.83pershareonadilutedbasisin
fiscal2013,and$73.6millionbeforetax,$53.0millionaftertaxand$0.35pershareonadilutedbasisinfiscal2012.
(c) Allfiscalyearspresented included the impact oftax benefits primarilyduetothereleaseof valuation allowances net of
additionalreservesincluding$16.5millionand$0.12pershareonadilutedbasisinfiscal2016,$55.1millionand$0.39
pershareonadilutedbasisinfiscal2015,$43.8millionand$0.31pershareonadilutedbasisinfiscal2014,$50.4million
and$0.36pershareonadilutedbasisinfiscal2013,and$8.6millionand$0.06pershareonadilutedbasisinfiscal2012.
(d) Allfiscalyearspresentedwereimpactedbyotherexpenseorincomeamountsthatimpactthecomparabilitybetweenyears
includinga gainonlegalsettlement of $22.1millionbeforetax,$13.5 millionaftertaxand$0.09 pershareona diluted
basisinfiscal2014,againonbargainpurchaseandotherof$31.0million beforeandaftertaxand$0.22pershareona
dilutedbasisinfiscal2013,andagainonbargainpurchaseandotherof$2.9millionbeforetax,$3.5millionaftertaxand
$0.02pershareonadilutedbasisinfiscal2012.
20
(a)
(b)
(c)
(d)
(e)