Avon 2001 Annual Report Download - page 8
Download and view the complete annual report
Please find page 8 of the 2001 Avon annual report below. You can navigate through the pages in the report by either clicking on the pages listed below, or by using the keyword search tool below to find specific information within the annual report.-
 1
1 -
 2
2 -
 3
3 -
 4
4 -
 5
5 -
 6
6 -
 7
7 -
 8
8 -
 9
9 -
 10
10 -
 11
11 -
 12
12 -
 13
13 -
 14
14 -
 15
15 -
 16
16 -
 17
17 -
 18
18 -
 19
19 -
20
-
21
-
22
-
23
-
24
-
25
-
26
-
27
-
28
-
29
-
30
-
31
-
32
-
33
-
34
-
35
-
36
-
37
-
38
-
39
-
40
-
41
-
42
-
43
-
44
-
45
-
46
-
47
-
48
-
49
 |
 |

PAGE 31
The labor dispute did not have a material impact on our
full year operations in the U.S.
U.S. operating profit and operating margin could
be adversely affected in 2003 by changes in current and
future assumptions, as well as actual experience, related
to the U.S. pension plan. See the “Liquidity and Capital
Resources” section of Management’s Discussion of Results
of Operations and Financial Condition.
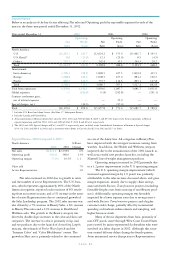
Latin America %/Point Change
Local
2002 2001 US$ Currency
Net sales $1,700.1 $1,898.5 (10)% 13%
Operating profit 378.8 427.5 (11)% 7%
Operating margin 22.3% 22.5% (.2) (.2)
Units sold 9%
Active Representatives 10%
Net sales in U.S. dollars were significantly impacted
by weaker foreign exchange rates in most major markets.
Excluding the impact of foreign currency exchange, Net
sales increased in 2002 with increases in all major markets
in the region, reflecting growth in units and active
Representatives.
• In Argentina, Net sales in U.S. dollars decreased signifi-
cantly due to the negative impact of foreign exchange,
but increased in local currency despite the country’s eco-
nomic and political issues, driven by growth in active
Representatives. Local management has taken numerous
actions to counter the challenges presented by this eco-
nomic and political crisis.
• In Venezuela, Net sales in U.S. dollars decreased due to
the negative impact of foreign exchange, but increased
significantly in local currency, despite the country’s eco-
nomic and political issues during 2002, benefiting from
inflationary price increases, new product launches and
consumer promotions.
• In Brazil, Net sales in U.S. dollars decreased due
to the negative impact of foreign exchange, but
increased significantly in local currency, reflecting
increases in units and active Representatives as well as
successful product launches.
• In Mexico, Net sales increased in U.S. dollars and local
currency, benefiting from new product launches with
higher price points in non-CFT product lines.
The decrease in operating margin in Latin America
was most significantly impacted by the following markets:
• In Argentina, operating margin decreased (which
decreased segment margin by .4 point) primarily due to
an increase in the expense ratio. The higher expense
ratio was driven by an increase in the cost of imported
supplies resulting from the devaluation of the Argentine
peso, as well as increased sales incentives, sampling and
higher banking taxes.
• In Central America, operating margin decreased (which
decreased segment margin by .3 point) primarily due to
an increase in the expense ratio resulting from incre-
mental marketing investments such as advertising, and
additional bad debt expense.
Operating margin was favorably impacted by
greater contributions from countries with higher operat-
ing margins (which increased segment margin by .5 point).
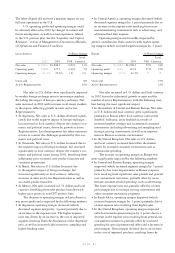
Europe %/Point Change
Local
2002 2001 US$ Currency
Net sales $1,228.6 $1,008.5 22% 19%
Operating profit 212.4 167.0 27% 25%
Operating margin 17.2% 16.5% .7 .7
Units sold 27%
Active Representatives 22%
Net sales increased in U.S. dollars and local currency
in 2002 driven by substantial growth in units and the
number of active Representatives with the following mar-
kets having the most significant impact:
• In the markets of Central and Eastern Europe, Net sales
in U.S. dollars and local currency grew significantly,
primarily in Russia where local currency sales nearly
doubled. In Russia, units doubled as a result of
increased market coverage and incremental consumer
investments (including advertising and sampling) and
strategic pricing investments, as well as an improve-
ment in Russia’s economic environment.
• In the United Kingdom, Net sales in U.S. dollars
and local currency increased faster than the market
driven by increased consumer investments such as
promotional spending.
The increase in operating margin in Europe was
most significantly impacted by the following markets:
• In Central and Eastern Europe, operating margin
improved (which increased segment margin by .5 point)
primarily due to an improvement in Russia’s expense
ratio resulting from significant sales growth and general
cost containment initiatives, partially offset by incre-
mental consumer-related spending, such as advertising.
The lower expense ratio was partially offset by a lower
gross margin due to strategic pricing investments and
other consumer motivation programs.
• In South Africa, operating margin improved (which
increased segment margin by .3 point) primarily due to
a lower expense ratio resulting from higher sales.
• In the United Kingdom, operating margin improved
(which increased segment margin by .2 point) due to a
decrease in the expense ratio resulting from general cost
containment initiatives, partially offset by increased
spending for special promotional offers and a decrease in
gross margin. Gross margin declined due to an increase
in the cost of imported products, resulting from the