BP 2008 Annual Report Download - page 11
Download and view the complete annual report
Please find page 11 of the 2008 BP annual report below. You can navigate through the pages in the report by either clicking on the pages listed below, or by using the keyword search tool below to find specific information within the annual report.-
 1
1 -
 2
2 -
 3
3 -
 4
4 -
 5
5 -
 6
6 -
 7
7 -
 8
8 -
 9
9 -
 10
10 -
 11
11 -
 12
12 -
 13
13 -
 14
14 -
 15
15 -
 16
16 -
 17
17 -
 18
18 -
 19
19 -
 20
20 -
 21
21 -
 22
22 -
23
-
24
-
25
-
26
-
27
-
28
-
29
-
30
-
31
-
32
-
33
-
34
-
35
-
36
-
37
-
38
-
39
-
40
-
41
-
42
-
43
-
44
-
45
-
46
-
47
-
48
-
49
-
50
-
51
-
52
-
53
-
54
-
55
-
56
-
57
-
58
-
59
-
60
-
61
-
62
-
63
-
64
-
65
-
66
-
67
-
68
-
69
-
70
-
71
-
72
-
73
-
74
-
75
-
76
-
77
-
78
-
79
-
80
-
81
-
82
-
83
-
84
-
85
-
86
-
87
-
88
-
89
-
90
-
91
-
92
-
93
-
94
-
95
-
96
-
97
-
98
-
99
-
100
-
101
-
102
-
103
-
104
-
105
-
106
-
107
-
108
-
109
-
110
-
111
-
112
-
113
-
114
-
115
-
116
-
117
-
118
-
119
-
120
-
121
-
122
-
123
-
124
-
125
-
126
-
127
-
128
-
129
-
130
-
131
-
132
-
133
-
134
-
135
-
136
-
137
-
138
-
139
-
140
-
141
-
142
-
143
-
144
-
145
-
146
-
147
-
148
-
149
-
150
-
151
-
152
-
153
-
154
-
155
-
156
-
157
-
158
-
159
-
160
-
161
-
162
-
163
-
164
-
165
-
166
-
167
-
168
-
169
-
170
-
171
-
172
-
173
-
174
-
175
-
176
-
177
-
178
-
179
-
180
-
181
-
182
-
183
-
184
-
185
-
186
-
187
-
188
-
189
-
190
-
191
-
192
-
193
-
194
-
195
-
196
-
197
-
198
-
199
-
200
-
201
-
202
-
203
-
204
-
205
-
206
-
207
-
208
-
209
-
210
-
211
 |
 |

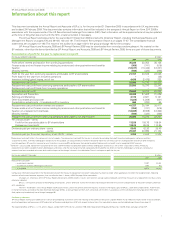
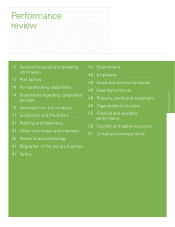
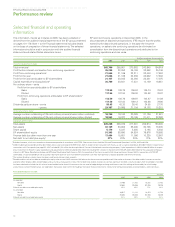
Selected financial and operating
information
This information, insofar as it relates to 2008, has been extracted or
derived from the audited financial statements of the BP group presented
on pages 101-179. Note 1 to the Financial statements includes details
on the basis of preparation of these financial statements. The selected
information should be read in conjunction with the audited financial
statements and related Notes elsewhere herein.
BP sold its Innovene operations in December 2005. In the
circumstances of discontinued operations, IFRS require that the profits
earned by the discontinued operations, in this case the Innovene
operations, on sales to the continuing operations be eliminated on
consolidation from the discontinued operations and attributed to the
continuing operations and vice versa.
BP Annual Report and Accounts 2008
Performance review
$ million except per share amounts
2008 2007 2006 2005 2004
Income statement data
Total revenuesa365,700 288,951 270,602 243,948 194,919
Profit before interest and taxation from continuing operationsa35,239 32,352 35,158 32,682 25,746
Profit from continuing operationsa21,666 21,169 22,311 22,448 17,884
Profit for the year 21,666 21,169 22,286 22,632 17,262
Profit for the year attributable to BP shareholders 21,157 20,845 22,000 22,341 17,075
Capital expenditure and acquisitionsb30,700 20,641 17,231 14,149 16,651
Per ordinary share – cents
Profit for the year attributable to BP shareholders
Basic 112.59 108.76 109.84 105.74 78.24
Diluted 111.56 107.84 109.00 104.52 76.87
Profit from continuing operations attributable to BP shareholdersa
Basic 112.59 108.76 109.97 104.87 81.09
Diluted 111.56 107.84 109.12 103.66 79.66
Dividends paid per share – cents 55.05 42.30 38.40 34.85 27.70
– pence 29.387 20.995 21.104 19.152 15.251
Ordinary share datac
Average number outstanding of 25 cent ordinary shares (shares million undiluted) 18,790 19,163 20,028 21,126 21,821
Average number outstanding of 25 cent ordinary shares (shares million diluted) 18,963 19,327 20,195 21,411 22,293
Balance sheet data
Total assets 228,238 236,076 217,601 206,914 194,630
Net assets 92,109 94,652 85,465 80,765 78,235
Share capital 5,176 5,237 5,385 5,185 5,403
BP shareholders’ equity 91,303 93,690 84,624 79,976 76,892
Finance debt due after more than one year 17,464 15,651 11,086 10,230 12,907
Net debt to net debt plus equityd21% 22% 20% 17% 22%
aExcludes Innovene, which was treated as a discontinued operation in accordance with IFRS 5 ‘Non-current Assets Held for Sale and Discontinued Operations’ in 2004, 2005 and 2006.
b2008 included capital expenditure of $2,822 million and an asset exchange of $1,909 million, both in respect of our transaction with Husky, as well as capital expenditure of $3,667 million in respect of our
transactions with Chesapeake (see page 51). 2007 included $1,132 million for the acquisition of Chevron’s Netherlands manufacturing company. Capital expenditure in 2006 included $1 billion in respect
of our investment in Rosneft. Capital expenditure and acquisitions for 2004 included $1,354 million for including TNK’s interest in Slavneft within TNK-BP and $1,355 million for the acquisition of Solvay’s
interests in BP Solvay Polyethylene Europe and BP Solvay Polyethylene North America. With the exception of the shares issued to Alfa Group and Access Renova (AAR) in connection with TNK-BP
(2004-2006), all capital expenditure and acquisitions during the past five years have been financed from cash flow from operations, disposal proceeds and external financing.
cThe number of ordinary shares shown has been used to calculate per share amounts.
dNet debt and the ratio of net debt to net debt plus equity ratio are non-GAAP measures. We believe that these measures provide useful information to investors. Net debt enables investors to see the
economic effect of gross debt, related hedges and cash and cash equivalents in total. The net debt ratio enables investors to see how significant net debt is relative to equity from shareholders. Net debt
has been redefined to include the fair value of associated derivative financial instruments that are used to hedge foreign exchange and interest rate risks relating to finance debt, for which hedge
accounting is claimed. The derivatives are reported on the balance sheet within the headings ‘Derivative financial instruments’. Amounts for comparative periods are presented on a consistent basis.
Revised definition of net debt
$ million
2007 2006 2005 2004
As reported
Net debt 27,483 21,420 16,202 21,732
Equity 94,652 85,465 80,765 78,235
Ratio of net debt to net debt plus equity 23% 20% 17% 22%
As amended
Net debt 26,817 21,122 16,373 21,732
Equity 94,652 85,465 80,765 78,235
Ratio of net debt to net debt plus equity 22% 20% 17% 22%
10