BP 2009 Annual Report Download - page 17
Download and view the complete annual report
Please find page 17 of the 2009 BP annual report below. You can navigate through the pages in the report by either clicking on the pages listed below, or by using the keyword search tool below to find specific information within the annual report.-
 1
1 -
2
-
3
-
4
-
5
-
6
-
 7
7 -
 8
8 -
 9
9 -
 10
10 -
 11
11 -
 12
12 -
 13
13 -
 14
14 -
 15
15 -
 16
16 -
 17
17 -
 18
18 -
 19
19 -
 20
20 -
 21
21 -
 22
22 -
 23
23 -
 24
24 -
 25
25 -
 26
26 -
 27
27 -
28
-
29
-
30
-
31
-
32
-
33
-
34
-
35
-
36
-
37
-
38
-
39
-
40
-
41
-
42
-
43
-
44
-
45
-
46
-
47
-
48
-
49
-
50
-
51
-
52
-
53
-
54
-
55
-
56
-
57
-
58
-
59
-
60
-
61
-
62
-
63
-
64
-
65
-
66
-
67
-
68
-
69
-
70
-
71
-
72
-
73
-
74
-
75
-
76
-
77
-
78
-
79
-
80
-
81
-
82
-
83
-
84
-
85
-
86
-
87
-
88
-
89
-
90
-
91
-
92
-
93
-
94
-
95
-
96
-
97
-
98
-
99
-
100
-
101
-
102
-
103
-
104
-
105
-
106
-
107
-
108
-
109
-
110
-
111
-
112
-
113
-
114
-
115
-
116
-
117
-
118
-
119
-
120
-
121
-
122
-
123
-
124
-
125
-
126
-
127
-
128
-
129
-
130
-
131
-
132
-
133
-
134
-
135
-
136
-
137
-
138
-
139
-
140
-
141
-
142
-
143
-
144
-
145
-
146
-
147
-
148
-
149
-
150
-
151
-
152
-
153
-
154
-
155
-
156
-
157
-
158
-
159
-
160
-
161
-
162
-
163
-
164
-
165
-
166
-
167
-
168
-
169
-
170
-
171
-
172
-
173
-
174
-
175
-
176
-
177
-
178
-
179
-
180
-
181
-
182
-
183
-
184
-
185
-
186
-
187
-
188
-
189
-
190
-
191
-
192
-
193
-
194
-
195
-
196
-
197
-
198
-
199
-
200
-
201
-
202
-
203
-
204
-
205
-
206
-
207
-
208
-
209
-
210
-
211
-
212
 |
 |

BP Annual Report and Accounts 2009
Business review
15
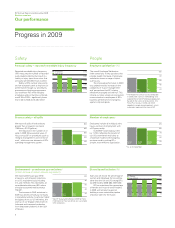
Our performance
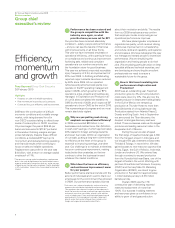
2009 has been a successful year for BP, with
positive financial and operational momentum
despite an extremely turbulent global financial
environment.
Safety
Good progress has been made on underpinning improved safety
performance in 2009. Throughout the year, we continued to focus on
training and enhancing procedures across the organization. Significantly,
2009 was an important year in the development of OMS. By the end
of 2009, around 80% of our operating sites were using the system,
including all our operated refineries and petrochemicals plants. (See
Safety on page 46 for more information on OMS.)
In 2009, a third-party-operated helicopter carrying contractors
from BP’s Miller platform crashed in the North Sea, resulting in the tragic
loss of 16 lives. In addition, BP sustained two fatalities within our own
operations. We deeply regret the loss of these lives.
Recordable injury frequency (RIF, a measure of the number of
reported injuries per 200,000 hours worked) was 0.34, significantly below
2008 and 2007 levels of 0.43 and 0.48, respectively. Reported oil spills
greater than one barrel were 234 in 2009 compared with 335 in 2008 and
340 in 2007. Our environmental measure that tracks greenhouse gas
(GHG) emissionsaincreased in 2009 to 65.0 million tonnes of carbon
dioxide equivalent, compared with 61.4 million tonnes in 2008. The
primary reason for this increase is the growth of our business, including
the significant increase in our US refining throughputs, the start-up of our
Tangguh LNG project in Indonesia and the continued success of our Gulf
of Mexico deepwater operations, including Thunder Horse.
People
During 2009 we made further significant progress in generating
a stronger performance focus and in fostering a culture that attributes
more value to deep specialist skills and expertise. At the same time, we
continued to improve operational efficiency and reduce overheads.
Non-retail headcount was reduced by 4,400 (6%) in 2009. Overall,
the number of employees (including retail staff) was reduced by 11,700
in 2009.
Business review
Business review – Group overview
Performance
Against the backdrop of the global recession, we delivered a strong
performance in 2009. Profit and cash flow were lower than in 2008, due
primarily to a much weaker price environment, although the impact was
partially offset by better operational performance and lower costs across
the group as we implemented our efficiency programmes. Notable
achievements include:
Exploration and Production
• Replacing 129% of our proved reserves, on a combined basis of
subsidiaries and equity-accounted entities.
• Delivering a 5% underlying growth in productionb.
• Reducing unit production costs by 12%.
• Achieving a strong gas marketing and trading performance.
• Accessing new resources in Egypt, the Gulf of Mexico, Indonesia,
Iraq and Jordan.
• Making the Tiber discovery in the Gulf of Mexico at a depth of over
35,000 feet, the deepest oil and gas discovery well ever drilled.
• Making three further discoveries in Block 31, Angola.
• Starting up Tangguh in Indonesia and six other major projects in the
Gulf of Mexico, Trinidad and Russia.
Refining and Marketing
• Restoring our overall performance so that it is once again competitive
with our supermajor peers.
• Achieving a Solomon refining availabilitycof 93.6%, which is an
increase of almost five percentage points compared with 2008.
• Reducing costs across the segment by more than 15%d.
• Delivering a strong supply and trading performance.
• Performing strongly in our international businesses, despite the weak
environment.
• Delivering simplification and lower costs through integration in the
fuels value chains.
• Simplifying the segment’s footprint in aviation and lubricants and
completing the transfer of our US convenience retail business to a
franchise operation.
• Successfully exiting from our ground fuels marketing business in
Greece.
aSee footnote a in Environment on page 47.
bUnderlying production growth excludes the effect of entitlement changes in our production-sharing
agreements (driven by changes in oil and gas prices) and the effect of OPEC quota restrictions.
cRefining availability represents Solomon Associates’ operational availability, which is defined as the
percentage of the year that a unit is available for processing after subtracting the annualized time
lost due to turnaround activity and all planned mechanical, process and regulatory maintenance
downtime.
dBased on Refining and Marketing’s share of production and manufacturing expenses plus
distribution and administration expenses.