BP 2011 Annual Report Download - page 32
Download and view the complete annual report
Please find page 32 of the 2011 BP annual report below. You can navigate through the pages in the report by either clicking on the pages listed below, or by using the keyword search tool below to find specific information within the annual report.-
 1
1 -
2
-
3
-
4
-
5
-
6
-
7
-
8
-
9
-
10
-
11
-
12
-
13
-
14
-
15
-
16
-
17
-
18
-
19
-
20
-
21
-
 22
22 -
 23
23 -
 24
24 -
 25
25 -
 26
26 -
 27
27 -
 28
28 -
 29
29 -
 30
30 -
 31
31 -
 32
32 -
 33
33 -
 34
34 -
 35
35 -
 36
36 -
 37
37 -
 38
38 -
 39
39 -
 40
40 -
 41
41 -
 42
42 -
43
-
44
-
45
-
46
-
47
-
48
-
49
-
50
-
51
-
52
-
53
-
54
-
55
-
56
-
57
-
58
-
59
-
60
-
61
-
62
-
63
-
64
-
65
-
66
-
67
-
68
-
69
-
70
-
71
-
72
-
73
-
74
-
75
-
76
-
77
-
78
-
79
-
80
-
81
-
82
-
83
-
84
-
85
-
86
-
87
-
88
-
89
-
90
-
91
-
92
-
93
-
94
-
95
-
96
-
97
-
98
-
99
-
100
-
101
-
102
-
103
-
104
-
105
-
106
-
107
-
108
-
109
-
110
-
111
-
112
-
113
-
114
-
115
-
116
-
117
-
118
-
119
-
120
-
121
-
122
-
123
-
124
-
125
-
126
-
127
-
128
-
129
-
130
-
131
-
132
-
133
-
134
-
135
-
136
-
137
-
138
-
139
-
140
-
141
-
142
-
143
-
144
-
145
-
146
-
147
-
148
-
149
-
150
-
151
-
152
-
153
-
154
-
155
-
156
-
157
-
158
-
159
-
160
-
161
-
162
-
163
-
164
-
165
-
166
-
167
-
168
-
169
-
170
-
171
-
172
-
173
-
174
-
175
-
176
-
177
-
178
-
179
-
180
-
181
-
182
-
183
-
184
-
185
-
186
-
187
-
188
-
189
-
190
-
191
-
192
-
193
-
194
-
195
-
196
-
197
-
198
-
199
-
200
-
201
-
202
-
203
-
204
-
205
-
206
-
207
-
208
-
209
-
210
-
211
-
212
-
213
-
214
-
215
-
216
-
217
-
218
-
219
-
220
-
221
-
222
-
223
-
224
-
225
-
226
-
227
-
228
-
229
-
230
-
231
-
232
-
233
-
234
-
235
-
236
-
237
-
238
-
239
-
240
-
241
-
242
-
243
-
244
-
245
-
246
-
247
-
248
-
249
-
250
-
251
-
252
-
253
-
254
-
255
-
256
-
257
-
258
-
259
-
260
-
261
-
262
-
263
-
264
-
265
-
266
-
267
-
268
-
269
-
270
-
271
-
272
-
273
-
274
-
275
-
276
-
277
-
278
-
279
-
280
-
281
-
282
-
283
-
284
-
285
-
286
-
287
-
288
-
289
-
290
-
291
-
292
-
293
-
294
-
295
-
296
-
297
-
298
-
299
-
300
 |
 |
30 BP Annual Report and Form 20-F 2011
activities of refining, logistics, marketing, and supply and trading on a regional
basis. This recognizes the geographic nature of the markets in which we compete,
providing the opportunity to optimize our activities from crude oil purchases to
end-consumer sales through our physical assets (refineries, terminals, pipelines
and retail stations). In addition, we operate a global aviation fuels business and an
LPG marketing business, from which we intend to divest the bulk and bottled LPG
marketing operations.
We own or have a share in 16 refineries including five in the US and seven
in Europe. Our focus is on complex, upgraded refineries that are able to process
cheaper feedstocks yet yield more valuable products. We also market fuels
through around 21,800 retail sites, principally in the US, Europe, Australia and
southern Africa. Many of our retail sites are now operated by franchisees with
whom we work in close partnership as we seek to ensure our standards and
brand are consistently applied. We divest assets and businesses when we believe
they will be of greater value to others. In 2011, we announced that we are seeking
buyers for our Texas City refinery; and for our Carson refinery near Los Angeles,
together with its associated integrated marketing business in southern California,
Arizona and Nevada.
Our lubricants business is involved in manufacturing and marketing lubricants
and related services to markets around the world. In 2011, approximately 45% of
our profit from lubricants was generated from non-OECD markets, and we see
good opportunities for further growth in these areas. We market lubricants to the
automotive, industrial, marine, aviation and energy markets. The business blends
and markets lubricants globally through our key brands of Castrol, BP and Aral.
Our strategic relationships with our original equipment manufacturing partners
provide the ongoing collaboration needed to develop the next generation of high-
performance lubricants, such as Castrol EDGE.
Our petrochemicals business operates on a global basis and includes the
manufacture and marketing of petrochemicals that are used in many everyday
products, such as plastic bottles and textiles for clothing. Future growth in our
business is focused on the demand centres of Asia, where our relationships
with joint venture partners are key to our strategy in these increasingly important
markets. From 2012 we plan to create a new revenue stream in petrochemicals
through licensing some of our leading technology.
Our organization: Business model
Above BP is working
with Mendel
Biotechnology to
develop and
commercialize
seed products with
high resistance to
environmental stresses,
such as water and
nutrient limitation.
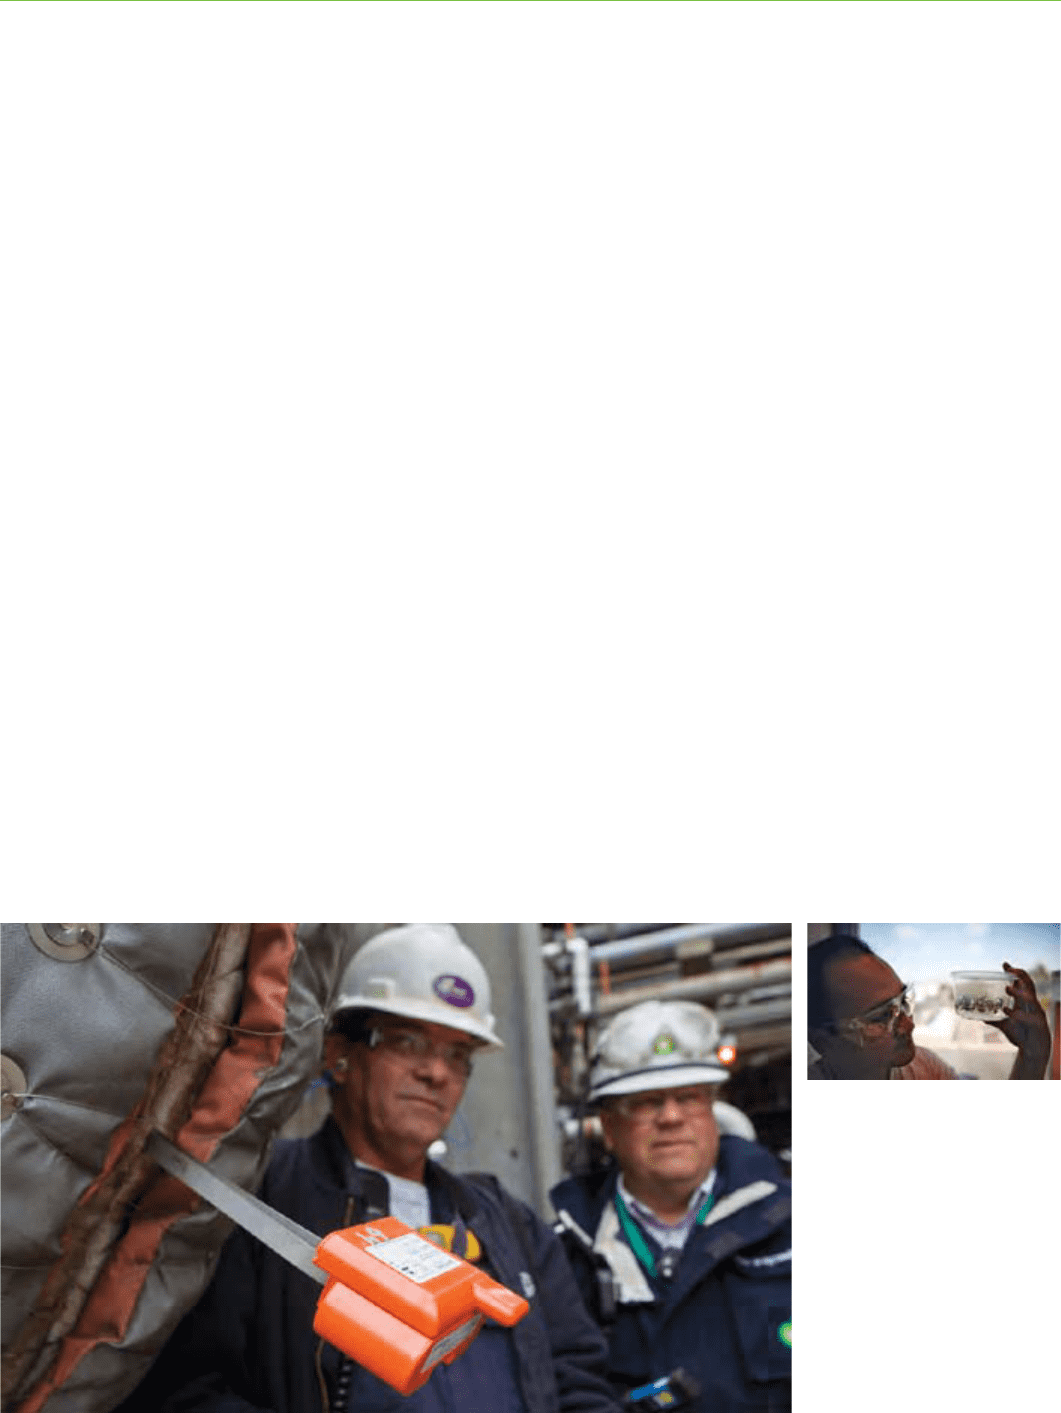
Left Developed with
Imperial College London,
new Permasense sensors
are helping BP corrosion
engineers to see what is
happening inside pipes.