BP 2015 Annual Report Download - page 48
Download and view the complete annual report
Please find page 48 of the 2015 BP annual report below. You can navigate through the pages in the report by either clicking on the pages listed below, or by using the keyword search tool below to find specific information within the annual report.-
 1
1 -
2
-
3
-
4
-
5
-
6
-
7
-
8
-
9
-
10
-
11
-
12
-
13
-
14
-
15
-
16
-
17
-
18
-
19
-
20
-
21
-
22
-
23
-
24
-
25
-
26
-
27
-
28
-
29
-
30
-
31
-
32
-
33
-
34
-
35
-
36
-
37
-
 38
38 -
 39
39 -
 40
40 -
 41
41 -
 42
42 -
 43
43 -
 44
44 -
 45
45 -
 46
46 -
 47
47 -
 48
48 -
 49
49 -
 50
50 -
 51
51 -
 52
52 -
 53
53 -
 54
54 -
 55
55 -
 56
56 -
 57
57 -
 58
58 -
59
-
60
-
61
-
62
-
63
-
64
-
65
-
66
-
67
-
68
-
69
-
70
-
71
-
72
-
73
-
74
-
75
-
76
-
77
-
78
-
79
-
80
-
81
-
82
-
83
-
84
-
85
-
86
-
87
-
88
-
89
-
90
-
91
-
92
-
93
-
94
-
95
-
96
-
97
-
98
-
99
-
100
-
101
-
102
-
103
-
104
-
105
-
106
-
107
-
108
-
109
-
110
-
111
-
112
-
113
-
114
-
115
-
116
-
117
-
118
-
119
-
120
-
121
-
122
-
123
-
124
-
125
-
126
-
127
-
128
-
129
-
130
-
131
-
132
-
133
-
134
-
135
-
136
-
137
-
138
-
139
-
140
-
141
-
142
-
143
-
144
-
145
-
146
-
147
-
148
-
149
-
150
-
151
-
152
-
153
-
154
-
155
-
156
-
157
-
158
-
159
-
160
-
161
-
162
-
163
-
164
-
165
-
166
-
167
-
168
-
169
-
170
-
171
-
172
-
173
-
174
-
175
-
176
-
177
-
178
-
179
-
180
-
181
-
182
-
183
-
184
-
185
-
186
-
187
-
188
-
189
-
190
-
191
-
192
-
193
-
194
-
195
-
196
-
197
-
198
-
199
-
200
-
201
-
202
-
203
-
204
-
205
-
206
-
207
-
208
-
209
-
210
-
211
-
212
-
213
-
214
-
215
-
216
-
217
-
218
-
219
-
220
-
221
-
222
-
223
-
224
-
225
-
226
-
227
-
228
-
229
-
230
-
231
-
232
-
233
-
234
-
235
-
236
-
237
-
238
-
239
-
240
-
241
-
242
-
243
-
244
-
245
-
246
-
247
-
248
-
249
-
250
-
251
-
252
-
253
-
254
-
255
-
256
-
257
-
258
-
259
-
260
-
261
-
262
-
263
-
264
-
265
-
266
 |
 |
maintenance practices, to avoid accidents. Our approach builds on our
experience, including learning from incidents, operations audits, annual
risk reviews and sharing lessons learned with our industry peers.
BP-operated businesses are responsible for identifying and managing
operating risks and bringing together people with the right skills and
competencies to address them. They are required to carry out self-
verification and are also subject to independent scrutiny and assurance.
Our safety and operational risk team works alongside BP-operated
businesses to provide oversight and technical guidance, while our group
audit team visits sites on a risk-prioritized basis, including third-party
drilling rigs, to check how they are managing risks.
Each business segment has a safety and operational risk committee,
chaired by the business head, to oversee the management of safety and
operational risk in their respective areas of the business. In addition the
group operations risk committee facilitates the group chief executive’s
oversight of safety and operational risk management across BP.
The board’s safety, ethics and environment assurance committee
(SEEAC) receives updates from the group chief executive and the head
of safety and operational risk on the management of the highest priority
risks. SEEAC also receives updates on BP’s process and personal safety
performance, and the monitoring of major incidents and near misses
across the group. See Our management of risk on page 51 and SEEAC’s
report on page 71.
Operating management system
BP’s OMS is a group-wide framework designed to help us manage risks
and drive performance improvements in BP-operated businesses. It brings
together BP requirements on health, safety, security, the environment,
social responsibility and operational reliability, as well as related issues
such as maintenance, contractor relations and organizational learning, into a
common management system.
We review and amend our group requirements within OMS from time to
time to reflect BP’s priorities and experience or changing external
regulations. Any variations in the application of OMS – in order to meet
local regulations or circumstances – are subject to a governance process.
OMS also helps us improve the quality of our activities. All businesses
covered by OMS undertake an annual performance improvement cycle and
assess alignment with the applicable requirements of the OMS
framework. Recently acquired operations need to transition to OMS. See
page 45 for information about contractors and joint arrangements.
Security and crisis management
The scale and spread of BP’s operations means we must prepare for a
range of potential business disruptions and emergency events. We monitor
for, and aim to guard against, hostile actions that could cause harm to our
people or disrupt our operations, including physical and digital threats and
vulnerabilities.
Cyber attacks present a risk to the security of our information, IT systems
and operations. We maintain a range of defences to help prevent and
respond to this threat, including a 24-hour monitoring centre in the US and
employee cyber awareness programmes.
We also maintain disaster recovery, crisis and business continuity
management plans and work to build day-to-day response capabilities to
support local management of incidents. See page 47 for information on
BP’s approach to oil spill preparedness and response.
Upstream safety
Safety performance
2015 2014 2013
Recordable injury frequency 0.21 0.23 0.32
Day away from work case frequency 0.034 0.051 0.068
Loss of primary containment
incidents – number 153 187 143
Safer drilling
Our global wells organization is responsible for planning and executing our
wells operations across the world. It is also responsible for establishing
standards on compliance, risk management, contractor management,
performance indicators, technology and capability for our well operations.
Completing the Bly Report recommendations
We have completed all 26 recommendations made by BP’s investigation
into the Deepwater Horizon accident, the Bly Report, aimed at further
reducing risk across our global drilling activities.
Our group audit team has verified closure of the recommendations.
See bp.com/26recommendations for the Bly Report recommendations.
The BP board appointed Carl Sandlin as independent expert in 2012 to
provide an objective assessment of BP’s global progress in implementing
the recommendations from the Bly Report. He also provided process
safety observations and his views on the organizational effectiveness and
culture of the global wells organization.
Over the period of his appointment Mr Sandlin met regularly with wells
organization leadership and reviewed the standards and practices
developed to complete the recommendations. He made three visits to
each of the regional wells teams with active drilling operations, meeting
key personnel and drilling contractors on site.
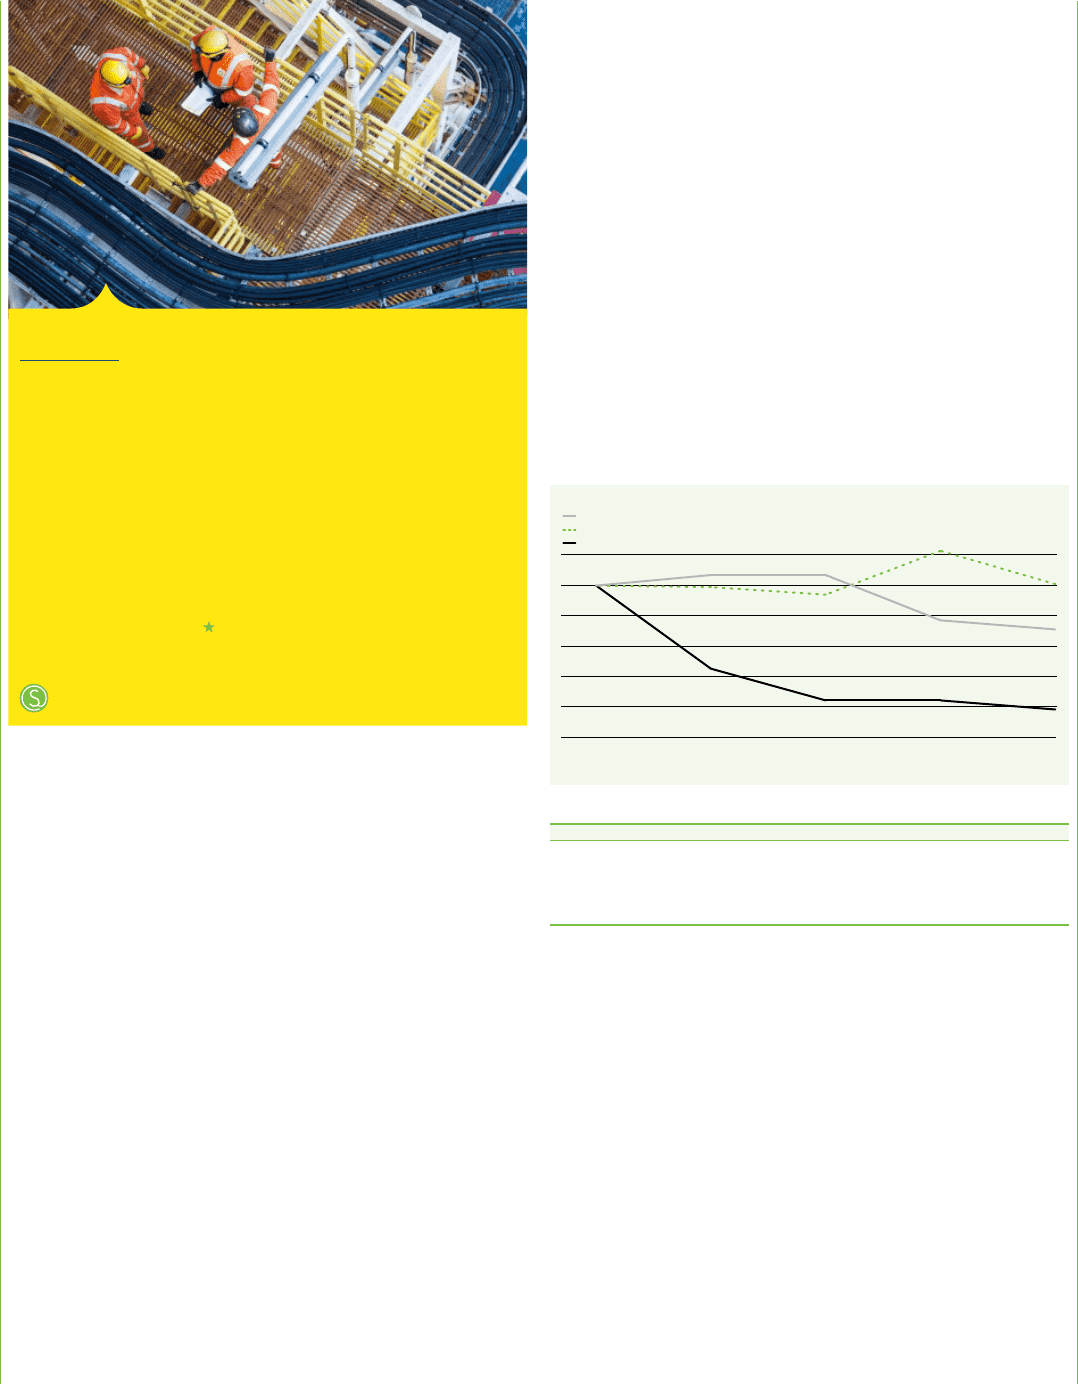
20122011 2013 2014
2015
Key safety metrics 2011-2015
80
60
40
20
100
120
Loss of primary containment
Tier 1 process safety events
Recordable injury frequency
Indexed (2011=100)
Improving reliability
Periodic breaks in production for planned maintenance are essential to
keep our operations running safely and reliably, but BP’s production in
the UK North Sea had suffered from unplanned shutdowns from
equipment failure on ageing infrastructure.
In 2013 we took action to address these unplanned shut-downs
through the development and implementation of reliability improvement
plans. These focused on three key areas: having spare equipment
available for parts that are particularly vulnerable; investing in getting
our basic maintenance activities right to prevent failures in the first
place; and learning from the equipment failures, by identifying the root
cause and sharing those learnings across the organization.
We are rolling these plans out across all five UK offshore assets and as
a result, our plant reliability has improved from 70% in 2014 to more
than 84% in 2015. We expect that this will not only improve production
and revenue, but also extend the life of our fields.
Prioritizing the safety and reliability of our operations.
BP Annual Report and Form 20-F 201544