Baskin Robbins 2013 Annual Report Download - page 79
Download and view the complete annual report
Please find page 79 of the 2013 Baskin Robbins annual report below. You can navigate through the pages in the report by either clicking on the pages listed below, or by using the keyword search tool below to find specific information within the annual report.-
 1
1 -
2
-
3
-
4
-
5
-
6
-
7
-
8
-
9
-
10
-
11
-
12
-
13
-
14
-
15
-
16
-
17
-
18
-
19
-
20
-
21
-
22
-
23
-
24
-
25
-
26
-
27
-
28
-
29
-
30
-
31
-
32
-
33
-
34
-
35
-
36
-
37
-
38
-
39
-
40
-
41
-
42
-
43
-
44
-
45
-
46
-
47
-
48
-
49
-
50
-
51
-
52
-
53
-
54
-
55
-
56
-
57
-
58
-
59
-
60
-
61
-
62
-
63
-
64
-
65
-
66
-
67
-
68
-
 69
69 -
 70
70 -
 71
71 -
 72
72 -
 73
73 -
 74
74 -
 75
75 -
 76
76 -
 77
77 -
 78
78 -
 79
79 -
 80
80 -
 81
81 -
 82
82 -
 83
83 -
 84
84 -
 85
85 -
 86
86 -
 87
87 -
 88
88 -
 89
89 -
90
-
91
-
92
-
93
-
94
-
95
-
96
-
97
-
98
-
99
-
100
-
101
-
102
-
103
-
104
-
105
-
106
-
107
-
108
-
109
-
110
-
111
-
112
-
113
-
114
-
115
-
116
 |
 |

-69-
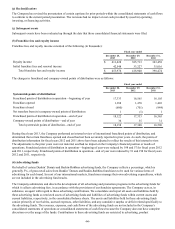
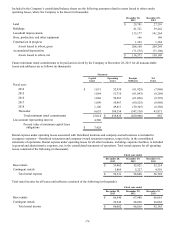
Total estimated amortization expense, net of deferred tax benefits, to be included in net income of equity method investments
for fiscal years 2014 through 2018 is as follows (in thousands):
Fiscal year:
2014 $ 408
2015 345
2016 277
2017 205
2018 128
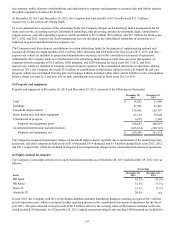
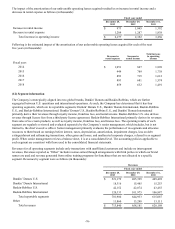
During the third quarter of 2013, the Company fully reserved all outstanding notes and accounts receivable totaling $2.8
million, and fully impaired its equity investment in the Spain JV of $873 thousand. The reserves on accounts and notes
receivable are included in general and administrative expenses, net, and the impairment of the equity investment is included in
net income (loss) of equity method investments in the consolidated statements of operations.
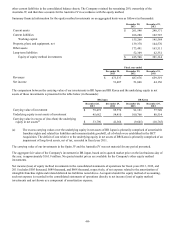
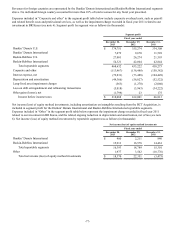
During the fourth quarter of 2011, management concluded that indicators of potential impairment were present related to our
investment in BR Korea based on continued declines in the operating performance and future projections of the Korea Dunkin’
Donuts business. Accordingly, the Company engaged an independent third-party valuation specialist to assist the Company in
determining the fair value of our investment in BR Korea. The valuation was completed using a combination of discounted
cash flow and income approaches to valuation. Based in part on the fair value determined by the independent third-party
valuation specialist, the Company determined that the carrying value of the investment in BR Korea exceeded fair value by
$19.8 million, and as such the Company recorded an impairment charge for that amount in the fourth quarter of 2011. The
impairment charge was allocated to the underlying goodwill, intangible assets, and long-lived assets of BR Korea, and therefore
resulted in a reduction in depreciation and amortization, net of tax, of $2.0 million, $3.6 million, and $1.0 million, in fiscal
years 2013, 2012, and 2011, respectively, which is recorded within net income (loss) of equity method investments in the
consolidated statements of operations.
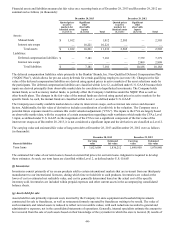
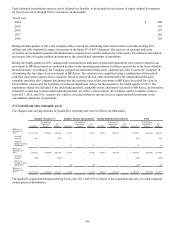
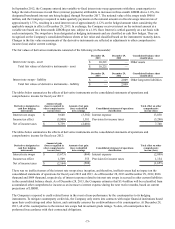
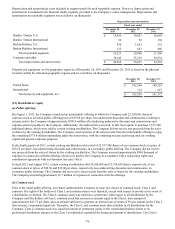
(7) Goodwill and other intangible assets
The changes and carrying amounts of goodwill by reporting unit were as follows (in thousands):
Dunkin’ Donuts U.S. Dunkin’ Donuts International Baskin-Robbins International Total
Goodwill
Accumulated
impairment
charges
Net
Balance Goodwill
Accumulated
impairment
charges
Net
Balance Goodwill
Accumulated
impairment
charges
Net
Balance Goodwill
Accumulated
impairment
charges
Net
Balance
Balances at
December 31,
2011 $1,151,140 (270,441) 880,699 10,293 — 10,293 24,037 (24,037) — 1,185,470 (294,478) 890,992
Goodwill
acquired 895 — 895 — — — — — — 895 — 895
Effects of
foreign currency
adjustments — — — 13 — 13 — — — 13 — 13
Balances at
December 29,
2012 1,152,035 (270,441) 881,594 10,306 — 10,306 24,037 (24,037) — 1,186,378 (294,478) 891,900
Goodwill
disposed (260) — (260) — — — — — — (260) — (260)
Effects of
foreign currency
adjustments — — — (42) — (42) — — — (42) — (42)
Balances at
December 28,
2013 $1,151,775 (270,441) 881,334 10,264 — 10,264 24,037 (24,037) — 1,186,076 (294,478) 891,598
The goodwill acquired and disposed during fiscal years 2013 and 2012 is related to the acquisition and sale of certain company-
owned points of distribution.