Best Buy 2000 Annual Report Download - page 35
Download and view the complete annual report
Please find page 35 of the 2000 Best Buy annual report below. You can navigate through the pages in the report by either clicking on the pages listed below, or by using the keyword search tool below to find specific information within the annual report.-
 1
1 -
2
-
3
-
4
-
5
-
6
-
7
-
8
-
9
-
10
-
11
-
12
-
13
-
14
-
15
-
16
-
17
-
18
-
19
-
20
-
21
-
22
-
23
-
24
-
 25
25 -
 26
26 -
 27
27 -
 28
28 -
 29
29 -
 30
30 -
 31
31 -
 32
32 -
 33
33 -
 34
34 -
 35
35 -
 36
36 -
 37
37 -
 38
38 -
 39
39 -
 40
40 -
 41
41 -
 42
42 -
 43
43 -
 44
44 -
 45
45 -
46
-
47
-
48
-
49
-
50
-
51
-
52
 |
 |

33
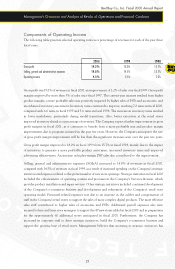
$ in thousands
Best Buy Co., Inc. Fiscal 2000 Annual Report
Feb. 26 Feb. 27 Feb. 28
For the Fiscal Years Ended 2000 1999 1998
Operating Activities
Net earnings $ 347,070 $ 216,282 $ 81,938
Depreciation, amortization and
other non-cash charges 109,541 78,367 71,584
456,611 294,649 153,522
Changes in operating assets and liabilities:
Receivables (56,900) (36,699) (16,121)
Merchandise inventories (137,315) 14,422 71,271
Other assets (11,005) (4,251) (3,278)
Accounts payable 302,194 249,094 147,340
Other liabilities 108,829 82,544 63,950
Accrued income taxes 97,814 62,672 33,759
Total cash provided by operating activities 760,228 662,431 450,443
Investing Activities
Additions to property and equipment (361,024) (165,698) (72,063)
(Increase) decrease in recoverable costs
from developed properties (21,009) (65,741) 45,270
(Increase) decrease in other assets (18,081) (18,128) 4,494
Total cash used in investing activities (400,114) (249,567) (22,299)
Financing Activities
Long-term debt payments (29,946) (165,396) (22,694)
Long-term debt borrowings –– 10,000
Issuance of common stock 32,229 20,644 14,869
Repurchase of common stock (397,451) (2,462) –
Total cash (used in) provided by
financing activities (395,168) (147,214) 2,175
(Decrease) Increase in Cash and Cash Equivalents (35,054) 265,650 430,319
Cash and Cash Equivalents at Beginning of Period 785,777 520,127 89,808
Cash and Cash Equivalents at End of Period $ 750,723 $ 785,777 $ 520,127
See Notes to Consolidated Financial Statements.
Consolidated Statements of Cash Flows