Cardinal Health 2010 Annual Report Download - page 72
Download and view the complete annual report
Please find page 72 of the 2010 Cardinal Health annual report below. You can navigate through the pages in the report by either clicking on the pages listed below, or by using the keyword search tool below to find specific information within the annual report.-
 1
1 -
2
-
3
-
4
-
5
-
6
-
7
-
8
-
9
-
10
-
11
-
12
-
13
-
14
-
15
-
16
-
17
-
18
-
19
-
20
-
21
-
22
-
23
-
24
-
25
-
26
-
27
-
28
-
29
-
30
-
31
-
32
-
33
-
34
-
35
-
36
-
37
-
38
-
39
-
40
-
41
-
42
-
43
-
44
-
45
-
46
-
47
-
48
-
49
-
50
-
51
-
52
-
53
-
54
-
55
-
56
-
57
-
58
-
59
-
60
-
61
-
 62
62 -
 63
63 -
 64
64 -
 65
65 -
 66
66 -
 67
67 -
 68
68 -
 69
69 -
 70
70 -
 71
71 -
 72
72 -
 73
73 -
 74
74 -
 75
75 -
 76
76 -
 77
77 -
 78
78 -
 79
79 -
 80
80 -
 81
81 -
 82
82 -
83
-
84
-
85
-
86
-
87
-
88
-
89
-
90
-
91
-
92
-
93
-
94
-
95
-
96
-
97
-
98
-
99
-
100
-
101
-
102
-
103
-
104
-
105
-
106
-
107
-
108
-
109
-
110
-
111
-
112
-
113
-
114
-
115
-
116
-
117
-
118
-
119
-
120
-
121
-
122
-
123
-
124
-
125
-
126
-
127
-
128
-
129
-
130
 |
 |

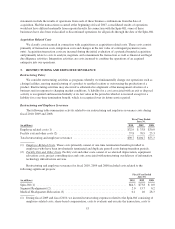
The following table summarizes all of our customers that individually account for at least 10% of revenu
e
and their corresponding percent of gross trade receivables. The customers in the table below are serviced through
o
ur Pharmaceutical segment
.
Percent o
f
Revenu
e
Percent o
fG
ros
s
Tr
ade
R
ece
i
vab
l
es at
June
30
,
2010
2009
2008
2010
2009
W
algreen Co
.
................................................ 24% 24% 20% 32% 3
6%
CVS Caremark Cor
p
oratio
n
....................................
22% 21% 23% 21% 21%
Certa
i
no
f
our
b
us
i
nesses
h
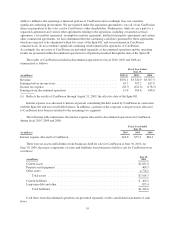
ave entere
di
nto a
g
reements w
i
t
hg
roup purc
h
as
i
n
g
or
g
an
i
zat
i
ons (“GPOs”)
w
hi
c
h
act as purc
h
as
i
n
g
a
g
ents t
h
at ne
g
ot
i
ate ven
d
or contracts on
b
e
h
a
lf
o
f
t
h
e
i
r mem
b
ers.
T
h
e
f
o
ll
ow
i
ng ta
bl
e summar
i
zes t
h
e revenue t
h
at was
d
er
i
ve
df
rom GPO mem
b
ers t
h
roug
h
t
h
e contractua
l
arrangements esta
bli
s
h
e
d
w
i
t
h
Novat
i
on, LLC an
d
Prem
i
er Purc
h
as
i
ng Partners, L.P., our two
l
argest GPO
r
e
l
at
i
ons
hi
ps
i
n terms o
f
revenue:
Percent of Revenue
20
1
0
2
009
2
008
G
PO members
.
.............................................................. 1
5
%1
5
%1
5%
Our tra
d
e rece
i
va
bl
e
b
a
l
ances are w
i
t
hi
n
di
v
id
ua
l
mem
b
ers o
f
t
h
e GPO an
d
t
h
ere
f
ore no s
ig
n
ifi
can
t
concentrat
i
on o
f
cre
di
tr
i
s
k
ex
i
sts w
i
t
h
t
h
ese t
y
pes o
f
arran
g
ements
.
In
v
entories
.
A
su
b
stant
i
a
l
port
i
on o
f
our
i
nventor
i
es (73% at June 30, 2010 an
d
74% June 30, 2009) ar
e
va
l
ue
d
at t
h
e
l
ower o
f
cost, us
i
n
g
t
h
e LIFO met
h
o
d
, or mar
k
et. T
h
ese
i
nventor
i
es are
i
nc
l
u
d
e
d
w
i
t
hi
nt
h
e core
ph
armaceut
i
ca
ldi
str
ib
ut
i
on
f
ac
ili
t
i
es o
f
our P
h
armaceut
i
ca
l
se
g
ment (“D
i
str
ib
ut
i
on
f
ac
ili
t
i
es”) an
d
are pr
i
mar
ily
merc
h
an
di
se
i
nventor
i
es. We
b
e
li
eve t
h
at t
h
e avera
g
e cost met
h
o
d
o
fi
nventor
y
va
l
uat
i
on prov
id
es a reasona
bl
e
approx
i
mat
i
on o
f
t
h
e current cost o
f
rep
l
ac
i
n
gi
nventor
y
w
i
t
hi
nt
h
eD
i
str
ib
ut
i
on
f
ac
ili
t
i
es. As suc
h
,t
h
e LIFO
r
eserve
i
st
h
e
diff
erence
b
etween (a)
i
nventor
y
at t
h
e
l
ower o
f
LIFO cost or mar
k
et an
d
(
b
)
i
nventor
y
at
r
ep
l
acement cost
d
eterm
i
ne
d
us
i
n
g
t
h
e avera
g
e cost met
h
o
d
o
fi
nventor
y
va
l
uat
i
on. In
fi
sca
l
2010 an
d
2009, we
did
not recor
d
an
y
LIFO reserve re
d
uct
i
ons
.
I
f we had used the average cost method of inventory valuation for all inventory within the Distribution
f
acilities, inventories would not have changed in fiscal 2010 or fiscal 2009. In fact, primarily due to continued
generic pharmaceutical deflation, inventories valued at LIFO were
$
37.7 million and
$
34.9 million higher tha
n
the average cost value as of June 30, 2010 and 2009, respectively. Our policy, however, is not to recor
d
inventories in excess of re
p
lacement cost
.
Our remainin
g
inventor
y
is primaril
y
stated at the lower of cost, usin
g
the FIFO method, or market
.
I
nventor
i
es presente
d
on t
h
e conso
lid
ate
db
a
l
ance s
h
eets are net o
f
reserves
f
or excess an
d
o
b
so
l
et
e
inventor
y
which were $34.4 million and $39.5 million at June 30, 2010 and 2009, respectivel
y
. We reserve for
i
nventor
y
o
b
so
l
escence us
i
n
g
est
i
mates
b
ase
d
on
hi
stor
i
ca
l
exper
i
ences, sa
l
es tren
d
s, spec
ifi
c cate
g
or
i
es o
f
i
nventor
y
an
d
a
g
eo
f
on-
h
an
di
nventor
y
.
C
ash Discounts
.
M
anufacturer cash discounts are recorded as a component of inventory cost and recognize
d
as a reduction of cost of products sold when the related inventory is sold
.
P
roperty and E
q
uipment
.
Propert
y
and equipment are carried at cost less accumulated depreciation. Propert
y
and e
q
ui
p
ment held for sale are recorded at the lower of cost or fair value less cost to sell. De
p
reciation ex
p
ens
e
is computed usin
g
the strai
g
ht-line method over the estimated useful lives of the assets, includin
g
capital leas
e
4
6