Chrysler 2005 Annual Report Download - page 65
Download and view the complete annual report
Please find page 65 of the 2005 Chrysler annual report below. You can navigate through the pages in the report by either clicking on the pages listed below, or by using the keyword search tool below to find specific information within the annual report.-
 1
1 -
2
-
3
-
4
-
5
-
6
-
7
-
8
-
9
-
10
-
11
-
12
-
13
-
14
-
15
-
16
-
17
-
18
-
19
-
20
-
21
-
22
-
23
-
24
-
25
-
26
-
27
-
28
-
29
-
30
-
31
-
32
-
33
-
34
-
35
-
36
-
37
-
38
-
39
-
40
-
41
-
42
-
43
-
44
-
45
-
46
-
47
-
48
-
49
-
50
-
51
-
52
-
53
-
54
-
 55
55 -
 56
56 -
 57
57 -
 58
58 -
 59
59 -
 60
60 -
 61
61 -
 62
62 -
 63
63 -
 64
64 -
 65
65 -
 66
66 -
 67
67 -
 68
68 -
 69
69 -
 70
70 -
 71
71 -
 72
72 -
 73
73 -
 74
74 -
 75
75 -
76
-
77
-
78
-
79
-
80
-
81
-
82
-
83
-
84
-
85
-
86
-
87
-
88
-
89
-
90
-
91
-
92
-
93
-
94
-
95
-
96
-
97
-
98
-
99
-
100
-
101
-
102
-
103
-
104
-
105
-
106
-
107
-
108
-
109
-
110
-
111
-
112
-
113
-
114
-
115
-
116
-
117
-
118
-
119
-
120
-
121
-
122
-
123
-
124
-
125
-
126
-
127
-
128
-
129
-
130
-
131
-
132
-
133
-
134
-
135
-
136
-
137
-
138
-
139
-
140
-
141
-
142
-
143
-
144
-
145
-
146
-
147
-
148
-
149
-
150
-
151
-
152
-
153
-
154
-
155
-
156
-
157
-
158
-
159
-
160
-
161
-
162
-
163
-
164
-
165
-
166
-
167
-
168
-
169
-
170
-
171
-
172
-
173
-
174
-
175
-
176
-
177
-
178
-
179
-
180
-
181
-
182
-
183
-
184
-
185
-
186
-
187
-
188
-
189
-
190
-
191
-
192
-
193
-
194
-
195
-
196
-
197
-
198
-
199
-
200
-
201
-
202
-
203
-
204
-
205
-
206
-
207
-
208
-
209
-
210
-
211
-
212
-
213
-
214
-
215
-
216
-
217
-
218
-
219
-
220
-
221
-
222
-
223
-
224
-
225
-
226
-
227
-
228
-
229
-
230
-
231
-
232
-
233
-
234
-
235
-
236
-
237
-
238
-
239
-
240
-
241
-
242
-
243
-
244
-
245
-
246
-
247
-
248
-
249
-
250
-
251
-
252
-
253
-
254
-
255
-
256
-
257
-
258
-
259
-
260
-
261
-
262
-
263
-
264
-
265
-
266
-
267
-
268
-
269
-
270
-
271
-
272
-
273
-
274
-
275
-
276
-
277
-
278
 |
 |
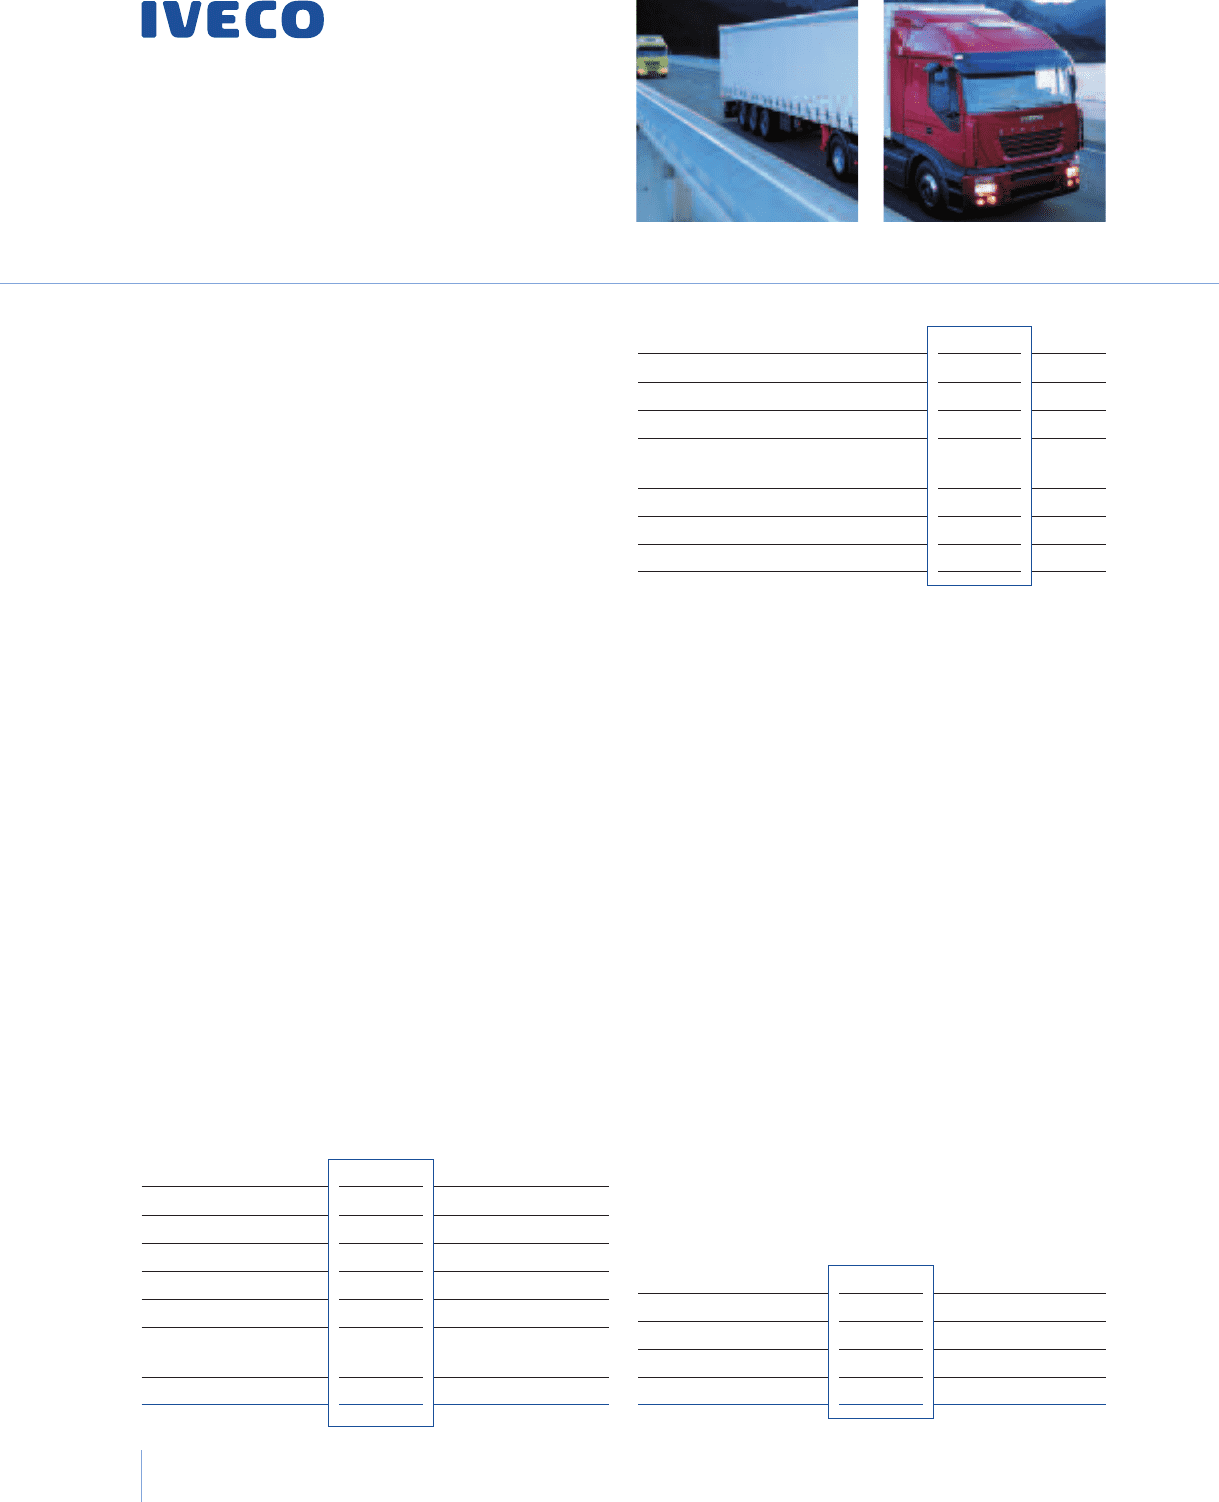
64 Reporton Operations Iveco
01 Report on Operations
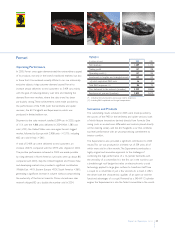
Operating Performance
In 2005, Western European demand for commercial vehicles (GVW
≥2.8 tons) increased to 1,109,700 units, or 5.2% more than in 2004.
The largest gains occurred in France (+10.8%) and Spain (+9.6%),
followed by more modest increases in the United Kingdom (+3.7%)
and Germany(+2.9%). In Italy, demand was down 1.7%.
New registrations of light commercial vehicles (GVW between 2.8
and 6 tons) grew to 779,800 units, for an increase of 4.3% compared
with 2004. Demand was particularly strong in Spain (+9.4%) and
France (+8.2%), expanded more moderately in Germany (+1.5%)
and the United Kingdom (+3.8%), and contracted in Italy (-2.1%).
Demand for medium vehicles (GVW between 6.1 and 15.9 tons)
also improved, rising to 79,100 units (+2.9% compared with 2004).
All of the European markets benefited from the increase in demand,
especiallyGermany (+8.7%) and Spain (+9.3%).The exceptions
were the United Kingdom, where new registrations were flat, and
Italy, where shipments were down (-6.6% with respect to 2004).
New registrations of heavy vehicles (GVW ≥16 tons) grew to
250,800 units, or 8.6% more than in 2004.The largest gains were
recorded in Spain (+10.0%), France (+21.6%), the United Kingdom
(+5.0%) and Germany (+4.1%). Demand held relatively steady in
Italy (+1.1%) but was up a healthy 8.9% in the remaining countries
of Western Europe.
In Western Europe, the bus market expanded to 34,800 units, or
6.6% more than in 2004.This improvement is the result of a positive
Commercial Vehicles
Iveco
Highlights
(in millions of euros) 2005 2004
Net revenues 9,489 9,047
Trading profit 415 371
Operating result (*) 289 347
Investments in tangible
and intangible assets (**) 444 330
-of which capitalised R&D costs 175 114
Total R&D expenses (***) 277 243
Employees at year-end (number) 32,373 31,037
(*) Including restructuring costs and unusual income (expenses).
(**) Net of vehicles sold with buy-back commitments.
(***) Including R&D capitalised and charged to operations.
Commercial Vehicles Market (GVW ≥2,8 tons)
(in thousands of units) 2005 2004 %change
Heavy 250.8 230.8 8.6
Medium 79.1 76.8 2.9
Light 779.8 747.3 4.3
Western Europe 1,109.7 1,054.9 5.2
Commercial Vehicles Market (GVW ≥2,8 tons)
(in thousands of units) 2005 2004 % change
France 194.0 175.0 10.8
Germany 238.1 231.3 2.9
United Kingdom 196.6 189.6 3.7
Italy 122.6 124.7 -1.7
Spain 118.5 108.1 9.6
Other Western
European Countries 239.9 226.2 6.0
Western Europe 1,109.7 1,054.9 5.2
trend in France (+11.9%), the United Kingdom (+23.3%) and Spain
(+15.9%), and steady demand in Germany and Italy.
Iveco’s share of the Western European market for vehicles with a curb
weight of 2.8 tons or more settled at 10.9% (0.2 percentage points less
than in 2004), due mainlyto weakness in Italy, where the Sector’s share
went from 29.8% in 2004 to 29.4% in 2005. In the light-vehicle segment
(Daily), Iveco’s market share held steady at 9.3%, with minor changes in
the different markets. In the medium-vehicle segment (Eurocargo), the
Sectors’ market share decreased to 26.3%, or 1.7 percentage points less
than in 2004. Nevertheless, Iveco was able to maintain and consolidate
its rank as the second largest producer. At 11.1%, Iveco’s share of the
heavy-vehicle segment was about the same as in 2004 (11.3%).
The Irisbus Group’s penetration of the Western European market
(20.4% in 2005) declined by 1 percentage point compared with 2004.
The Sector’smarket share contracted in Italy (-3.3 percentage points)
and France (-3.0 percentage points), where Iveco still controls a
significant portion of the market (about 45% to 50%), decreased by a
smaller percentage in Spain (-1.7 percentage points) and held relatively
steady in the United Kingdom (-0.4 percentage points) and Germany
(+0.6 percentage points).