Cisco 2010 Annual Report Download - page 58
Download and view the complete annual report
Please find page 58 of the 2010 Cisco annual report below. You can navigate through the pages in the report by either clicking on the pages listed below, or by using the keyword search tool below to find specific information within the annual report.-
 1
1 -
2
-
3
-
4
-
5
-
6
-
7
-
8
-
9
-
10
-
11
-
12
-
13
-
14
-
15
-
16
-
17
-
18
-
19
-
20
-
21
-
22
-
23
-
24
-
25
-
26
-
27
-
28
-
29
-
30
-
31
-
32
-
33
-
34
-
35
-
36
-
37
-
38
-
39
-
40
-
41
-
42
-
43
-
44
-
45
-
46
-
47
-
 48
48 -
 49
49 -
 50
50 -
 51
51 -
 52
52 -
 53
53 -
 54
54 -
 55
55 -
 56
56 -
 57
57 -
 58
58 -
 59
59 -
 60
60 -
 61
61 -
 62
62 -
 63
63 -
 64
64 -
 65
65 -
 66
66 -
 67
67 -
 68
68 -
69
-
70
-
71
-
72
-
73
-
74
-
75
-
76
-
77
-
78
-
79
-
80
-
81
-
82
-
83
-
84
 |
 |

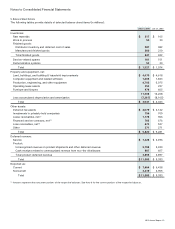
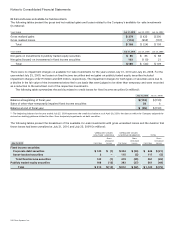
Notes to Consolidated Financial Statements
(b) Gains and Losses on Available-for-Sale Investments
The following tables present the gross and net realized gains and losses related to the Company’s available-for-sale investments
(in millions):
Years Ended July 31, 2010 July 25, 2009 July 26, 2008
Gross realized gains $ 279 $ 435 $ 306
Gross realized losses (110) (459) (197)
Total $ 169 $ (24) $ 109
Years Ended July 31, 2010 July 25, 2009 July 26, 2008
Net gains on investments in publicly traded equity securities $66 $86 $88
Net gains (losses) on investments in fixed income securities 103 (110) 21
Total $ 169 $ (24) $ 109
There were no impairment charges on available-for-sale investments for the years ended July 31, 2010 and July 26, 2008. For the
year ended July 25, 2009, net losses on fixed income securities and net gains on publicly traded equity securities included
impairment charges of $219 million and $39 million, respectively. The impairment charges for both types of securities were due to
a decline in the fair value of the investments below their cost basis that were judged to be other than temporary and were recorded
as a reduction to the amortized cost of the respective investments.
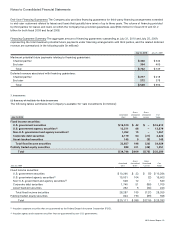
The following table summarizes the activity related to credit losses for fixed income securities (in millions):
July 31, 2010 July 25, 2009(1)
Balance at beginning of fiscal year $ (153) $ (159)
Sales of other-than-temporarily impaired fixed income securities 58 6
Balance at end of fiscal year $ (95) $ (153)
(1) The beginning balance for the year ended July 25, 2009 represents the credit loss balance as of April 26, 2009, the date on which the Company adopted the
revised accounting guidance related to other-than-temporary impairments on debt securities.
The following tables present the breakdown of the available-for-sale investments with gross unrealized losses and the duration that
those losses had been unrealized at July 31, 2010 and July 25, 2009 (in millions):
UNREALIZED LOSSES
LESS THAN 12 MONTHS
UNREALIZED LOSSES
12 MONTHS OR GREATER TOTAL
Fair Value
Gross
Unrealized
Losses Fair Value
Gross
Unrealized
Losses Fair Value
Gross
Unrealized
LossesJuly 31, 2010
Fixed income securities:
Corporate debt securities $ 140 $ (1) $ 304 $ (20) $ 444 $ (21)
Asset-backed securities 2 — 115 (5) 117 (5)
Total fixed income securities 142 (1) 419 (25) 561 (26)
Publicly traded equity securities 168 (12) 393 (37) 561 (49)
Total $ 310 $ (13) $ 812 $ (62) $ 1,122 $ (75)
56 Cisco Systems, Inc.