Dish Network 2009 Annual Report Download - page 111
Download and view the complete annual report
Please find page 111 of the 2009 Dish Network annual report below. You can navigate through the pages in the report by either clicking on the pages listed below, or by using the keyword search tool below to find specific information within the annual report.-
 1
1 -
2
-
3
-
4
-
5
-
6
-
7
-
8
-
9
-
10
-
11
-
12
-
13
-
14
-
15
-
16
-
17
-
18
-
19
-
20
-
21
-
22
-
23
-
24
-
25
-
26
-
27
-
28
-
29
-
30
-
31
-
32
-
33
-
34
-
35
-
36
-
37
-
38
-
39
-
40
-
41
-
42
-
43
-
44
-
45
-
46
-
47
-
48
-
49
-
50
-
51
-
52
-
53
-
54
-
55
-
56
-
57
-
58
-
59
-
60
-
61
-
62
-
63
-
64
-
65
-
66
-
67
-
68
-
69
-
70
-
71
-
72
-
73
-
74
-
75
-
76
-
77
-
78
-
79
-
80
-
81
-
82
-
83
-
84
-
85
-
86
-
87
-
88
-
89
-
90
-
91
-
92
-
93
-
94
-
95
-
96
-
97
-
98
-
99
-
100
-
 101
101 -
 102
102 -
 103
103 -
 104
104 -
 105
105 -
 106
106 -
 107
107 -
 108
108 -
 109
109 -
 110
110 -
 111
111 -
 112
112 -
 113
113 -
 114
114 -
 115
115 -
 116
116 -
 117
117 -
 118
118 -
 119
119 -
 120
120 -
 121
121 -
122
-
123
-
124
-
125
-
126
-
127
-
128
-
129
-
130
-
131
-
132
-
133
-
134
-
135
-
136
-
137
-
138
-
139
-
140
-
141
-
142
-
143
-
144
-
145
-
146
-
147
-
148
-
149
-
150
-
151
-
152
 |
 |

DISH NETWORK CORPORATION
NOTES TO CONSOLIDATED FINANCIAL STATEMENTS - Continued
F-21
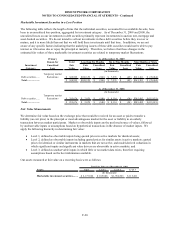
Changes in Level 3 instruments are as follows:
Total
Current and
Noncurrent
Marketable
Investment
Securities
Other
Investmen t
Securities
(
In thousands
)
Balance as of December 31, 2008.......................................................................................... 106,679$ 104,356$ 2,323$
Net realized/unrealized gains (losses) included in earnings..................................................... (11,858) (9,535) (2,323)
Net realized/unrealized gains (losses) included in other comprehensive income (loss)........... 37,205 37,205 -
Purchases, issuances and settlements, net ................................................................................ (19,015) (19,015) -
Balance as of December 31, 2009.......................................................................................... 113,011$ 113,011$ -$
Level 3
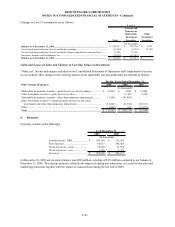
Gains and Losses on Sales and Changes in Carrying Values of Investments
“Other, net” income and expense included on our Consolidated Statements of Operations and Comprehensive Income
(Loss) includes other changes in the carrying amount of our marketable and non-marketable investments as follows:
Other I ncome (Expen se): 2009 2008 2007
Marketable investment securities - gains (losses) on sales/exchange............... $ 23,042 $ 2,095 $ 13,608
Other investment securities - gains (losses) on sales........................................ - 53,473 8,358
Marketable investment securities - other-than-temporary impairments ........... (1,050) (191,404) -
Other investment securities - unrealized gai ns (losses) on fair value
investments and other-than-temporary impairments .................................... (35,803) (33,534) (66,733)
Other................................................................................................................ (1,896) 657 (11,037)
Total................................................................................................................ (15,707)$ (168,713 )$ (55,804)$
For the Years Ended December 31,
(In thous ands)
6. Inventory
Inventory consists of the following:
2009 2008
Finished goods - DBS ...................... $ 199,189 $ 226,305
Raw materials ................................... 60,837 144,028
Work-in-process - used..................... 34,204 53,968
Work-in-process - new...................... 1,720 2,370
Inventory........................................... 295,95
0
$ 426,671$
As of December 31,
(In thou sands)
At December 31, 2009 our inventory balance was $296 million, a decline of $131 million compared to our balance at
December 31, 2008. This decline primarily related to the impact of adding new subscribers as a result of our sales and
marketing promotions together with the impact of reduced churn during the last half of 2009.