Electronic Arts 2002 Annual Report Download - page 61
Download and view the complete annual report
Please find page 61 of the 2002 Electronic Arts annual report below. You can navigate through the pages in the report by either clicking on the pages listed below, or by using the keyword search tool below to find specific information within the annual report.-
 1
1 -
2
-
3
-
4
-
5
-
6
-
7
-
8
-
9
-
10
-
11
-
12
-
13
-
14
-
15
-
16
-
17
-
18
-
19
-
20
-
21
-
22
-
23
-
24
-
25
-
26
-
27
-
28
-
29
-
30
-
31
-
32
-
33
-
34
-
35
-
36
-
37
-
38
-
39
-
40
-
41
-
42
-
43
-
44
-
45
-
46
-
47
-
48
-
49
-
50
-
 51
51 -
 52
52 -
 53
53 -
 54
54 -
 55
55 -
 56
56 -
 57
57 -
 58
58 -
 59
59 -
 60
60 -
 61
61 -
 62
62 -
 63
63 -
 64
64 -
 65
65 -
 66
66 -
 67
67 -
 68
68 -
 69
69 -
 70
70 -
 71
71 -
72
-
73
-
74
 |
 |

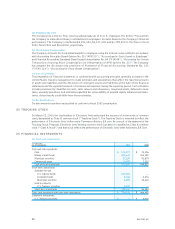
(In thousands, except per share data) 2002 2001 2000
CLASS B COMMON STOCK
Net loss:
As reported $(22,747) $(23,026) N/A
Pro forma $(23,592) $(23,857) N/A
Loss per share:
As reported – basic $(3.77) $(3.83) N/A
Pro forma – basic $(3.92) $(3.97) N/A
As reported – diluted $(3.77) $(3.83) N/A
Pro forma – diluted $(3.92) $(3.97) N/A
The fair value of each Class B option grant is estimated on the date of grant using the Black-Scholes option-
pricing model.The assumptions used were the same as those for Class A.
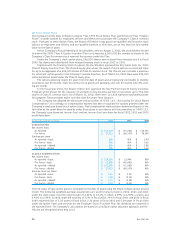
Additional information regarding options outstanding for Class A as of March 31, 2002 is as follows:
OPTIONS OUTSTANDING OPTIONS EXERCISABLE
WEIGHTED- WEIGHTED- WEIGHTED-
AVERAGE AVERAGE AVERAGE
NUMBER REMAINING EXERCISE NUMBER EXERCISE
RANGE OF EXERCISE PRICES OF SHARES CONTRACTUAL LIFE PRICE OF SHARES PRICE
$0.995 – $14.938 2,467,771 3.72 $ 11.88 2,460,911 $ 11.88
15.000 – 18.563 2,320,347 5.05 17.34 1,444,878 17.00
19.000 – 23.563 2,582,951 6.41 21.81 1,960,239 21.82
23.625 – 28.500 503,344 6.97 26.25 328,980 26.17
28.969 – 29.875 2,848,273 7.40 29.82 1,490,328 29.82
30.844 – 44.500 2,586,540 8.32 39.55 854,492 38.48
44.688 – 46.540 2,796,244 9.33 46.47 377,795 46.33
46.938 – 49.500 3,153,199 8.51 49.30 1,009,540 49.32
49.688 – 57.040 2,888,196 9.17 54.94 215,854 53.91
57.170 – 63.130 670,795 9.39 59.35 81,056 59.23
$ 0.995 – $63.130 22,817,660 7.42 $ 35.51 10,224,073 $ 26.04
Additional information regarding options outstanding for Class B as of March 31, 2002 is as follows:
OPTIONS OUTSTANDING OPTIONS EXERCISABLE
WEIGHTED- WEIGHTED- WEIGHTED-
AVERAGE AVERAGE AVERAGE
NUMBER REMAINING EXERCISE NUMBER EXERCISE
RANGE OF EXERCISE PRICES OF SHARES CONTRACTUAL LIFE PRICE OF SHARES PRICE
$9.000 2,611,719 8.00 $ 9.00 1,553,510 $ 9.00
10.000 65,275 8.34 10.00 27,952 10.00
12.000 1,484,171 8.96 12.00 425,937 12.00
$9.000 – $12.000 4,161,165 8.35 $ 10.09 2,007,399 $ 9.65
The following summarizes the activity under the Company’s Class A stock option plans during the fiscal
years ended March 31, 2002, 2001 and 2000:
OPTIONS OUTSTANDING
WEIGHTED-AVERAGE
SHARES EXERCISE PRICE
Balance at March 31, 1999 22,878,518 $ 15.33
Granted 7,815,952 31.92
Canceled (1,721,172) 21.68
Exercised (6,039,390) 12.42
Balance at March 31, 2000 (8,907,324 shares were exercisable
at a weighted average price of $14.93) 22,933,908 21.30
Granted 5,851,961 46.05
Canceled (1,746,449) 15.71
Exercised (5,495,281) 31.15
Balance at March 31, 2001 (8,902,789 shares were exercisable
at a weighted average price of $20.55) 21,544,139 28.66
Granted 6,313,776 51.29
Canceled (1,358,690) 36.14
Exercised (3,681,565) 22.27
Balance at March 31, 2002 22,817,660 $ 35.51
Options available for grant at March 31, 2002 3,510,216
EA 2002 AR 57