Experian 2013 Annual Report Download - page 142
Download and view the complete annual report
Please find page 142 of the 2013 Experian annual report below. You can navigate through the pages in the report by either clicking on the pages listed below, or by using the keyword search tool below to find specific information within the annual report.-
 1
1 -
2
-
3
-
4
-
5
-
6
-
7
-
8
-
9
-
10
-
11
-
12
-
13
-
14
-
15
-
16
-
17
-
18
-
19
-
20
-
21
-
22
-
23
-
24
-
25
-
26
-
27
-
28
-
29
-
30
-
31
-
32
-
33
-
34
-
35
-
36
-
37
-
38
-
39
-
40
-
41
-
42
-
43
-
44
-
45
-
46
-
47
-
48
-
49
-
50
-
51
-
52
-
53
-
54
-
55
-
56
-
57
-
58
-
59
-
60
-
61
-
62
-
63
-
64
-
65
-
66
-
67
-
68
-
69
-
70
-
71
-
72
-
73
-
74
-
75
-
76
-
77
-
78
-
79
-
80
-
81
-
82
-
83
-
84
-
85
-
86
-
87
-
88
-
89
-
90
-
91
-
92
-
93
-
94
-
95
-
96
-
97
-
98
-
99
-
100
-
101
-
102
-
103
-
104
-
105
-
106
-
107
-
108
-
109
-
110
-
111
-
112
-
113
-
114
-
115
-
116
-
117
-
118
-
119
-
120
-
121
-
122
-
123
-
124
-
125
-
126
-
127
-
128
-
129
-
130
-
131
-
 132
132 -
 133
133 -
 134
134 -
 135
135 -
 136
136 -
 137
137 -
 138
138 -
 139
139 -
 140
140 -
 141
141 -
 142
142 -
 143
143 -
 144
144 -
 145
145 -
 146
146 -
 147
147 -
 148
148 -
 149
149 -
 150
150 -
 151
151 -
 152
152 -
153
-
154
-
155
-
156
-
157
-
158
-
159
-
160
-
161
-
162
-
163
-
164
-
165
-
166
-
167
-
168
-
169
-
170
-
171
-
172
-
173
-
174
-
175
-
176
 |
 |
140 Experian Annual Report 2013 Financial statements
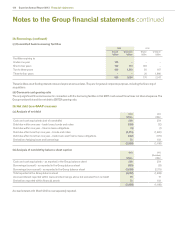
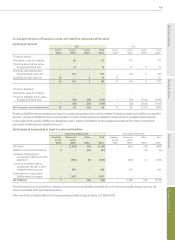
34. Maturity profile of financial liabilities – contractual undiscounted cash flows
(a) Contractual undiscounted cash flows for financial liabilities
From 31 March 2013
Less than
one year
US$m
One to two
years
US$m
Two to three
years
US$m
Three to four
years
US$m
Four to five
years
US$m
Over five
years
US$m
Total
US$m
Borrowings 716 177 567 77 669 1,339 3,545
Net settled derivative financial instruments 201612831
60
Gross settled derivative financial instruments3–––––3
Options in respect of non-controlling interests 17 – 15 – 41 – 73
Trade and other payables (note 28(b)) 44832226463
Cash outflows 1,204 196 596 87 715 1,346 4,144
From 31 March 2012
Less than
one year
(Restated)
US$m
One to two
years
(Restated)
US$m
Two to three
years
(Restated)
US$m
Three to four
years
(Restated)
US$m
Four to five
years
(Restated)
US$m
Over five
years
(Restated)
US$m
Total
(Restated)
US$m
Borrowings 105 727 132 62 62 1,462 2,550
Net settled derivative financial instruments 16 12 9 6 2 1 46
Gross settled derivative financial instruments 2 – – – – – 2
Put options in respect of Serasa and other
non-controlling interests 1,092 23 – 9 – – 1,124
Trade and other payables (note 28(b)) 446 5 3 2 3 6 465
Cash outflows 1,661 767 144 79 67 1,469 4,187
The table above analyses financial liabilities into maturity groupings based on the period from the balance sheet date to the contractual maturity
date. As the amounts disclosed are the contractual undiscounted cash flows, they differ from the carrying values and fair values.
Borrowings at 31 March 2012 of US$170m, which were previously reported in the less than one year category, are now included within later
categories to provide a more accurate presentation of the cash flows. As indicated in note 28(b), the analysis for trade and other payables is
restricted to items therein which are regarded as financial instruments, with prior year numbers re-presented in respect of obligations under
employee benefit plans.
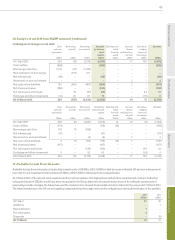
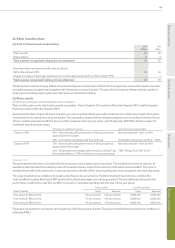
(b) Contractual undiscounted cash flows for derivative financial liabilities
From 31 March 2013
Less than
one year
US$m
One to two
years
US$m
Two to three
years
US$m
Three to four
years
US$m
Four to five
years
US$m
Over five
years
US$m
Total
US$m
Settled on a net basis – interest rate swaps 20 16 12 8 3 1 60
Settled on a gross basis:
Outflows for foreign exchange contracts 234 – – – – –
234
Inflows for foreign exchange contracts (231) – – – – – (231)
Settled on a gross basis 3 – – – – – 3
Cash outflows 23 16 12 8 3 1 63
From 31 March 2012
Less than
one year
US$m
One to two
years
US$m
Two to three
years
US$m
Three to four
years
US$m
Four to five
years
US$m
Over five
years
US$m
Total
US$m
Settled on a net basis – interest rate swaps 16 12 9 6 2 1 46
Settled on a gross basis:
Outflows for foreign exchange contracts 281 – – – – – 281
Inflows for foreign exchange contracts (279) – – – – – (279)
Settled on a gross basis 2 – – – – – 2
Cash outflows 18 12 9 6 2 1 48
The table above analyses the derivative financial liabilities into maturity groupings based on the period from the balance sheet date to the
contractual maturity date. As the amounts disclosed are the contractual undiscounted cash flows, they differ from the carrying values and
fair values.
Notes to the Group financial statements continued