Ford 2008 Annual Report Download - page 2
Download and view the complete annual report
Please find page 2 of the 2008 Ford annual report below. You can navigate through the pages in the report by either clicking on the pages listed below, or by using the keyword search tool below to find specific information within the annual report.-
 1
1 -
 2
2 -
 3
3 -
 4
4 -
 5
5 -
 6
6 -
 7
7 -
 8
8 -
 9
9 -
 10
10 -
 11
11 -
 12
12 -
 13
13 -
14
-
15
-
16
-
17
-
18
-
19
-
20
-
21
-
22
-
23
-
24
-
25
-
26
-
27
-
28
-
29
-
30
-
31
-
32
-
33
-
34
-
35
-
36
-
37
-
38
-
39
-
40
-
41
-
42
-
43
-
44
-
45
-
46
-
47
-
48
-
49
-
50
-
51
-
52
-
53
-
54
-
55
-
56
-
57
-
58
-
59
-
60
-
61
-
62
-
63
-
64
-
65
-
66
-
67
-
68
-
69
-
70
-
71
-
72
-
73
-
74
-
75
-
76
-
77
-
78
-
79
-
80
-
81
-
82
-
83
-
84
-
85
-
86
-
87
-
88
-
89
-
90
-
91
-
92
-
93
-
94
-
95
-
96
-
97
-
98
-
99
-
100
-
101
-
102
-
103
-
104
-
105
-
106
-
107
-
108
-
109
-
110
-
111
-
112
-
113
-
114
-
115
-
116
-
117
-
118
-
119
-
120
-
121
-
122
-
123
-
124
-
125
-
126
-
127
-
128
-
129
-
130
-
131
-
132
-
133
-
134
-
135
-
136
-
137
-
138
-
139
-
140
-
141
-
142
-
143
-
144
-
145
-
146
-
147
-
148
 |
 |

Ford Motor Company | 2008 Annual Report
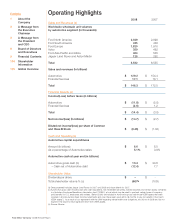
Sales and Revenues (a)
2008 2007
Worldwide wholesale unit volumes
by automotive segment (in thousands)
Ford North America 2,329 2,890
Ford South America 435 438
Ford Europe 1,820 1,918
Volvo 359 482
Ford Asia Pacific and Africa 464 535
Jaguar Land Rover and Aston Martin 125 292
Total 5,532 6,555
Sales and revenues (in billions)
Automotive $ 129.2 $ 154.4
Financial Services 17.1 18.1
Total $ 146.3 $ 172.5
Financial Results (a)
Income/(Loss) before taxes (in billions)
Automotive $ (11.8) $(5.0)
Financial Services (2.6) 1.2
Total $ (14.4) $ (3.8)
Net income/(loss) (in billions)$ (14.7) $ (2.7)
Diluted net income/(loss) per share of Common
and Class B Stock $ (6.46) $ (1.38)
Cash and Spending (a)
Automotive capital expenditures
Amount (in billions)$ 6.6 $ 6.0
As a percentage of Automotive sales 5.1% 3.9%
Automotive cash at year end (in billions)
Automotive gross cash (b) $ 13.4 $ 34.6
– Cash net of Automotive debt (12.4) 7.7
Shareholder Value
Dividends per share $– $-
Total shareholder returns % (c) (66)%(10)%
(a) Data presented includes Jaguar Land Rover for 2007 and 2008 and Aston Martin for 2007.
(b) Automotive gross cash includes cash and cash equivalents, net marketable securities, loaned securities and certain assets contained
in a Voluntary Employee Beneficiary Association trust (“VEBA”), a trust which may be used to pre-fund certain types of company-
paid benefits for U.S. employees and retirees. Before 2008, we included in Automotive gross cash those VEBA assets that were
invested in shorter-duration fixed income investments and could have been used within 18 months to pay for benefits (“short-term
VEBA assets”). As a result of our agreement with the UAW regarding retiree health care obligations, we did not in 2008 and do not
expect in the future to have significant short-term VEBA assets.
(c) Source: Bowne
Contents
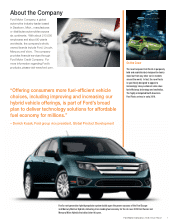
1About the
Company
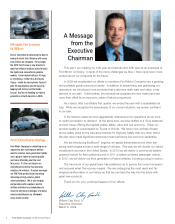
2A Message from
the Executive
Chairman
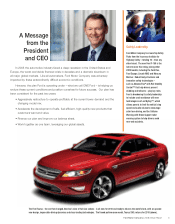
3A Message from
the President
and CEO
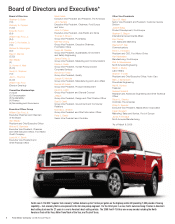
8Board of Directors
and Executives
9Financial Contents
144 Shareholder
Information
145 Global Overview
Operating Highlights