HSBC 2001 Annual Report Download - page 5
Download and view the complete annual report
Please find page 5 of the 2001 HSBC annual report below. You can navigate through the pages in the report by either clicking on the pages listed below, or by using the keyword search tool below to find specific information within the annual report.-
 1
1 -
 2
2 -
 3
3 -
 4
4 -
 5
5 -
 6
6 -
 7
7 -
 8
8 -
 9
9 -
 10
10 -
 11
11 -
 12
12 -
 13
13 -
 14
14 -
 15
15 -
 16
16 -
17
-
18
-
19
-
20
-
21
-
22
-
23
-
24
-
25
-
26
-
27
-
28
-
29
-
30
-
31
-
32
-
33
-
34
-
35
-
36
-
37
-
38
-
39
-
40
-
41
-
42
-
43
-
44
-
45
-
46
-
47
-
48
-
49
-
50
-
51
-
52
-
53
-
54
-
55
-
56
-
57
-
58
-
59
-
60
-
61
-
62
-
63
-
64
-
65
-
66
-
67
-
68
-
69
-
70
-
71
-
72
-
73
-
74
-
75
-
76
-
77
-
78
-
79
-
80
-
81
-
82
-
83
-
84
-
85
-
86
-
87
-
88
-
89
-
90
-
91
-
92
-
93
-
94
-
95
-
96
-
97
-
98
-
99
-
100
-
101
-
102
-
103
-
104
-
105
-
106
-
107
-
108
-
109
-
110
-
111
-
112
-
113
-
114
-
115
-
116
-
117
-
118
-
119
-
120
-
121
-
122
-
123
-
124
-
125
-
126
-
127
-
128
-
129
-
130
-
131
-
132
-
133
-
134
-
135
-
136
-
137
-
138
-
139
-
140
-
141
-
142
-
143
-
144
-
145
-
146
-
147
-
148
-
149
-
150
-
151
-
152
-
153
-
154
-
155
-
156
-
157
-
158
-
159
-
160
-
161
-
162
-
163
-
164
-
165
-
166
-
167
-
168
-
169
-
170
-
171
-
172
-
173
-
174
-
175
-
176
-
177
-
178
-
179
-
180
-
181
-
182
-
183
-
184
-
185
-
186
-
187
-
188
-
189
-
190
-
191
-
192
-
193
-
194
-
195
-
196
-
197
-
198
-
199
-
200
-
201
-
202
-
203
-
204
-
205
-
206
-
207
-
208
-
209
-
210
-
211
-
212
-
213
-
214
-
215
-
216
-
217
-
218
-
219
-
220
-
221
-
222
-
223
-
224
-
225
-
226
-
227
-
228
-
229
-
230
-
231
-
232
-
233
-
234
-
235
-
236
-
237
-
238
-
239
-
240
-
241
-
242
-
243
-
244
-
245
-
246
-
247
-
248
-
249
-
250
-
251
-
252
-
253
-
254
-
255
-
256
-
257
-
258
-
259
-
260
-
261
-
262
-
263
-
264
-
265
-
266
-
267
-
268
-
269
-
270
-
271
-
272
-
273
-
274
-
275
-
276
-
277
-
278
-
279
-
280
-
281
-
282
-
283
-
284
 |
 |

HSBC HOLDINGS PLC
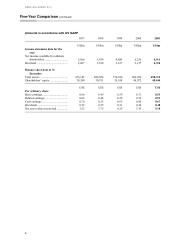
Five-Year Comparison
3
1997 1998 1999 2000 2001
US$m US$m US$m US$m US$m
At year-end
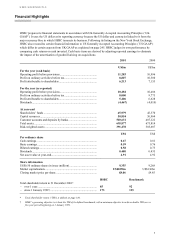
Share capital...................................... 3,406 3,443 4,230 4,634 4,678
Shareholders’ funds .......................... 27,080 27,402 33,408 45,570 45,979
Capital resources............................... 41,562 41,092 44,270 50,964 50,854
Customer accounts............................ 294,189 308,910 359,972 427,069 449,991
Undated subordinated loan capital.... 3,245 3,247 3,235 3,546 3,479
Dated subordinated loan capital........ 7,281 7,597 12,188 12,676 12,001
Loans and advances to customers* ... 240,421 235,295 253,567 289,837 308,649
Total assets........................................ 471,686 483,128 569,139 673,814 695,877
For the year
Net interest income ........................... 10,944 11,547 11,990 13,723 14,725
Other operating income..................... 7,665 8,508 9,012 10,850 11,163
Operating profit before provisions.... 8,553 9,051 9,653 10,486 10,484
Provisions for bad and doubtful
debts............................................ (1,014) (2,637) (2,073) (932) (2,037)
Pre-tax profits ................................... 8,130 6,571 7,982 9,775 8,000
Profit attributable to shareholders ..... 5,487 4,318 5,408 6,628 5,406
Dividends.......................................... (2,206) (2,495) (2,872) (4,010) (4,467)
US$US$US$US$US$
Per ordinary share†
Cash earnings.................................... 0.69 0.54 0.66 0.81 0.67
Basic earnings................................... 0.69 0.54 0.65 0.76 0.59
Diluted earnings................................ 0.68 0.53 0.65 0.75 0.58
Dividends.......................................... 0.277 0.308 0.340 0.435 0.480
Net asset value ................................. 3.37 3.38 3.95 4.92 4.91
Share information†
US$0.50 ordinary shares in issue...... 8,028m 8,067m 8,458m 9,268m 9,355m
%%%%%
Financial ratios
Dividend payout ratio ....................... 40.2 57.8 53.1 60.5 82.6
Post-tax return on average total
assets ........................................... 1.37 0.98 1.20 1.33 0.92
Return on average shareholders’
funds ........................................... 20.7 15.5 17.5 16.5 11.4
Average shareholders’ funds to
average total assets...................... 5.98 5.71 6.24 6.49 6.78
Capital ratios
Tier 1 capital..................................... 9.3 9.7 8.5 9.0 9.0
Total capital ...................................... 14.2 13.6 13.2 13.3 13.0
*Net of suspended interest and provisions for bad and doubtful debts.
†Per share amounts reported here and throughout the document reflect the share capital reorganisation on 2 July 1999