HSBC 2012 Annual Report Download - page 55
Download and view the complete annual report
Please find page 55 of the 2012 HSBC annual report below. You can navigate through the pages in the report by either clicking on the pages listed below, or by using the keyword search tool below to find specific information within the annual report.-
 1
1 -
2
-
3
-
4
-
5
-
6
-
7
-
8
-
9
-
10
-
11
-
12
-
13
-
14
-
15
-
16
-
17
-
18
-
19
-
20
-
21
-
22
-
23
-
24
-
25
-
26
-
27
-
28
-
29
-
30
-
31
-
32
-
33
-
34
-
35
-
36
-
37
-
38
-
39
-
40
-
41
-
42
-
43
-
44
-
 45
45 -
 46
46 -
 47
47 -
 48
48 -
 49
49 -
 50
50 -
 51
51 -
 52
52 -
 53
53 -
 54
54 -
 55
55 -
 56
56 -
 57
57 -
 58
58 -
 59
59 -
 60
60 -
 61
61 -
 62
62 -
 63
63 -
 64
64 -
 65
65 -
66
-
67
-
68
-
69
-
70
-
71
-
72
-
73
-
74
-
75
-
76
-
77
-
78
-
79
-
80
-
81
-
82
-
83
-
84
-
85
-
86
-
87
-
88
-
89
-
90
-
91
-
92
-
93
-
94
-
95
-
96
-
97
-
98
-
99
-
100
-
101
-
102
-
103
-
104
-
105
-
106
-
107
-
108
-
109
-
110
-
111
-
112
-
113
-
114
-
115
-
116
-
117
-
118
-
119
-
120
-
121
-
122
-
123
-
124
-
125
-
126
-
127
-
128
-
129
-
130
-
131
-
132
-
133
-
134
-
135
-
136
-
137
-
138
-
139
-
140
-
141
-
142
-
143
-
144
-
145
-
146
-
147
-
148
-
149
-
150
-
151
-
152
-
153
-
154
-
155
-
156
-
157
-
158
-
159
-
160
-
161
-
162
-
163
-
164
-
165
-
166
-
167
-
168
-
169
-
170
-
171
-
172
-
173
-
174
-
175
-
176
-
177
-
178
-
179
-
180
-
181
-
182
-
183
-
184
-
185
-
186
-
187
-
188
-
189
-
190
-
191
-
192
-
193
-
194
-
195
-
196
-
197
-
198
-
199
-
200
-
201
-
202
-
203
-
204
-
205
-
206
-
207
-
208
-
209
-
210
-
211
-
212
-
213
-
214
-
215
-
216
-
217
-
218
-
219
-
220
-
221
-
222
-
223
-
224
-
225
-
226
-
227
-
228
-
229
-
230
-
231
-
232
-
233
-
234
-
235
-
236
-
237
-
238
-
239
-
240
-
241
-
242
-
243
-
244
-
245
-
246
-
247
-
248
-
249
-
250
-
251
-
252
-
253
-
254
-
255
-
256
-
257
-
258
-
259
-
260
-
261
-
262
-
263
-
264
-
265
-
266
-
267
-
268
-
269
-
270
-
271
-
272
-
273
-
274
-
275
-
276
-
277
-
278
-
279
-
280
-
281
-
282
-
283
-
284
-
285
-
286
-
287
-
288
-
289
-
290
-
291
-
292
-
293
-
294
-
295
-
296
-
297
-
298
-
299
-
300
-
301
-
302
-
303
-
304
-
305
-
306
-
307
-
308
-
309
-
310
-
311
-
312
-
313
-
314
-
315
-
316
-
317
-
318
-
319
-
320
-
321
-
322
-
323
-
324
-
325
-
326
-
327
-
328
-
329
-
330
-
331
-
332
-
333
-
334
-
335
-
336
-
337
-
338
-
339
-
340
-
341
-
342
-
343
-
344
-
345
-
346
-
347
-
348
-
349
-
350
-
351
-
352
-
353
-
354
-
355
-
356
-
357
-
358
-
359
-
360
-
361
-
362
-
363
-
364
-
365
-
366
-
367
-
368
-
369
-
370
-
371
-
372
-
373
-
374
-
375
-
376
-
377
-
378
-
379
-
380
-
381
-
382
-
383
-
384
-
385
-
386
-
387
-
388
-
389
-
390
-
391
-
392
-
393
-
394
-
395
-
396
-
397
-
398
-
399
-
400
-
401
-
402
-
403
-
404
-
405
-
406
-
407
-
408
-
409
-
410
-
411
-
412
-
413
-
414
-
415
-
416
-
417
-
418
-
419
-
420
-
421
-
422
-
423
-
424
-
425
-
426
-
427
-
428
-
429
-
430
-
431
-
432
-
433
-
434
-
435
-
436
-
437
-
438
-
439
-
440
-
441
-
442
-
443
-
444
-
445
-
446
-
447
-
448
-
449
-
450
-
451
-
452
-
453
-
454
-
455
-
456
-
457
-
458
-
459
-
460
-
461
-
462
-
463
-
464
-
465
-
466
-
467
-
468
-
469
-
470
-
471
-
472
-
473
-
474
-
475
-
476
-
477
-
478
-
479
-
480
-
481
-
482
-
483
-
484
-
485
-
486
-
487
-
488
-
489
-
490
-
491
-
492
-
493
-
494
-
495
-
496
-
497
-
498
-
499
-
500
-
501
-
502
-
503
-
504
-
505
-
506
-
507
-
508
-
509
-
510
-
511
-
512
-
513
-
514
-
515
-
516
-
517
-
518
-
519
-
520
-
521
-
522
-
523
-
524
-
525
-
526
-
527
-
528
-
529
-
530
-
531
-
532
-
533
-
534
-
535
-
536
-
537
-
538
-
539
-
540
-
541
-
542
-
543
-
544
-
545
-
546
 |
 |

53
Overview Operating & Financial Review Corporate Governance Financial Statements Shareholder Information
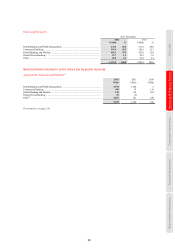
Summary income statements for disposals, held for sale and run-off portfolios69,70
2012
Held Run-off portfolios
Card and
Retail
Services
US$m
Ping An
US$m
Other
disposals
US$m
for sale
excluding
US CML
US$m
US CML
and other71
US$m
Legacy
credit in
GB&M
US$m
Net interest income/(expense) ............................ 1,267 – 352 303 2,561 (28)
Net fee income/(expense) ................................... 395 – 13 (35) 33 (17)
Net trading income/(expense) ............................ – – 67 22 (226) 99
Net income/(expense) from financial instruments
designated at fair value .................................. – – 3 5 (785) 10
Gains less losses from financial investments ..... – – 8 27 – (72)
Dividend income ................................................. – – – – 3 –
Net earned insurance premiums ......................... – – 430 315 – –
Other operating income/(expense) ..................... 7 – 10 5 37 (3)
Total operating income/(expense) ................... 1,669 – 883 642 1,623 (11)
Net insurance claims incurred and movement in
liabilities to policyholders ............................. – – (218) (225) – –
Net operating income/(expense)21..................... 1,669 – 665 417 1,623 (11)
Loan impairment charges and other
credit risk provisions ..................................... (322) – (16) (77) (2,569) (168)
Net operating income/(expense) ...................... 1,347 – 649 340 (946) (179)
Total operating expenses .................................... (729) – (467) (344) (1,106) (101)
Operating profit/(loss) ...................................... 618 – 182 (4) (2,052) (280)
Share of profit in associates and joint ventures .. – 763 12 9 2 –
Profit/(loss) before tax ...................................... 618 763 194 5 (2,050) (280)
By global business
Retail Banking and Wealth Management .......... 618 622 99 (29) (1,274) –
Commercial Banking .......................................... – 82 40 24 9 –
Global Banking and Markets .............................. – 59 65 28 – (280)
Global Private Banking ...................................... – – (9) – – –
Other ................................................................... – – (1) (18) (785) –
Profit/(loss) before tax ........................................ 618 763 194 5 (2,050) (280)
By geographical region
Europe ................................................................. – – (1) – – (281)
Hong Kong ......................................................... – – 45 – – 1
Rest of Asia-Pacific ............................................ – 763 (31) 22 – (2)
Middle East and North Africa ............................ – – 46 – – –
North America .................................................... 618 – 25 (25) (2,050) 2
Latin America ..................................................... – – 110 8 – –
Profit/(loss) before tax ........................................ 618 763 194 5 (2,050) (280)
Other information
Gain on sale ........................................................ 3,148 3,012 1,579
Fixed allocated costs included in total operating
expenses .......................................................... 188 – 77 52 230 –
US$bn US$bn US$bn US$bn US$bn US$bn
Reduction in RWAs on disposal72 ...................... 39.3 24.9 7.5 8.8
RWAs72 ............................................................... 9.3 107.1 38.6
% % % % % %
Share of HSBC’s profit before tax ..................... 3.0 3.7 0.9 – (10.0) (1.4)
Cost efficiency ratio ........................................... 43.7 – 70.2 82.5 68.1 –
For footnotes, see page 120.