Incredimail 2012 Annual Report Download - page 110
Download and view the complete annual report
Please find page 110 of the 2012 Incredimail annual report below. You can navigate through the pages in the report by either clicking on the pages listed below, or by using the keyword search tool below to find specific information within the annual report.-
 1
1 -
2
-
3
-
4
-
5
-
6
-
7
-
8
-
9
-
10
-
11
-
12
-
13
-
14
-
15
-
16
-
17
-
18
-
19
-
20
-
21
-
22
-
23
-
24
-
25
-
26
-
27
-
28
-
29
-
30
-
31
-
32
-
33
-
34
-
35
-
36
-
37
-
38
-
39
-
40
-
41
-
42
-
43
-
44
-
45
-
46
-
47
-
48
-
49
-
50
-
51
-
52
-
53
-
54
-
55
-
56
-
57
-
58
-
59
-
60
-
61
-
62
-
63
-
64
-
65
-
66
-
67
-
68
-
69
-
70
-
71
-
72
-
73
-
74
-
75
-
76
-
77
-
78
-
79
-
80
-
81
-
82
-
83
-
84
-
85
-
86
-
87
-
88
-
89
-
90
-
91
-
92
-
93
-
94
-
95
-
96
-
97
-
98
-
99
-
 100
100 -
 101
101 -
 102
102 -
 103
103 -
 104
104 -
 105
105 -
 106
106 -
 107
107 -
 108
108 -
 109
109 -
 110
110 -
 111
111 -
 112
112 -
 113
113 -
 114
114 -
 115
115 -
 116
116 -
 117
117 -
 118
118 -
 119
119 -
 120
120 -
121
-
122
-
123
-
124
-
125
-
126
-
127
-
128
-
129
-
130
-
131
-
132
-
133
-
134
-
135
-
136
-
137
-
138
-
139
-
140
-
141
-
142
-
143
-
144
-
145
-
146
-
147
-
148
-
149
-
150
-
151
-
152
-
153
-
154
-
155
-
156
-
157
-
158
-
159
-
160
-
161
-
162
-
163
-
164
-
165
-
166
-
167
-
168
-
169
-
170
-
171
-
172
-
173
-
174
-
175
-
176
-
177
-
178
-
179
-
180
-
181
-
182
-
183
-
184
-
185
-
186
-
187
-
188
-
189
-
190
-
191
-
192
-
193
-
194
-
195
-
196
-
197
-
198
-
199
-
200
-
201
-
202
-
203
-
204
-
205
-
206
-
207
-
208
-
209
-
210
-
211
-
212
-
213
-
214
-
215
-
216
-
217
-
218
-
219
-
220
-
221
-
222
-
223
-
224
-
225
-
226
-
227
-
228
-
229
-
230
-
231
-
232
-
233
-
234
-
235
-
236
-
237
-
238
-
239
-
240
-
241
-
242
-
243
-
244
-
245
-
246
-
247
-
248
-
249
-
250
-
251
-
252
-
253
-
254
-
255
-
256
-
257
-
258
-
259
-
260
-
261
-
262
-
263
-
264
-
265
-
266
-
267
-
268
-
269
-
270
-
271
-
272
-
273
-
274
-
275
-
276
-
277
-
278
-
279
-
280
-
281
-
282
-
283
-
284
-
285
-
286
-
287
-
288
-
289
-
290
-
291
-
292
-
293
-
294
-
295
-
296
-
297
-
298
-
299
-
300
-
301
-
302
-
303
-
304
-
305
-
306
-
307
-
308
-
309
-
310
-
311
-
312
-
313
-
314
-
315
-
316
-
317
-
318
-
319
-
320
-
321
-
322
-
323
-
324
-
325
-
326
-
327
-
328
-
329
-
330
-
331
-
332
-
333
-
334
-
335
-
336
-
337
-
338
-
339
-
340
-
341
-
342
-
343
-
344
-
345
 |
 |

PERION NETWORK LTD. AND ITS SUBSIDIARIES
NOTES TO CONSOLIDATED FINANCIAL STATEMENTS
U.S. dollars in thousands (except share and per share data)
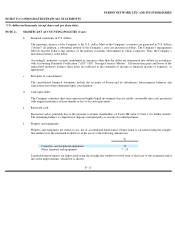
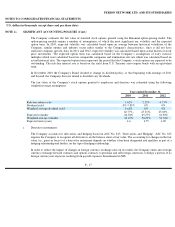
These instruments were not designated as cash flow hedge as defined by ASC 815, "Derivative and Hedging" and,
therefore, the Company recognized the changes in fair value of these instruments in the statement of income as financial
income or expense, as incurred. Gains or losses on these derivatives, which partially offset the foreign currency impact
from the underlying exposures, and amounted to $ (13), $ (25) and $ 238 for the years ended December 31, 2010, 2011
and 2012, respectively.
The notional value of the Company’
s derivative instruments as of December 31, 2011 and 2012 amounted to $ 4,300 and
$ 6,891, respectively. Notional values are U.S. dollar translated and calculated based on forward rates for forward
contracts and based on spot rates for options. Gross notional amounts do not quantify risk or represent assets or liabilities
of the Company, but are used in the calculation of settlements under the contracts. The Company measured the fair value
of these contracts in accordance with ASC No. 820 and they were classified as level 2.
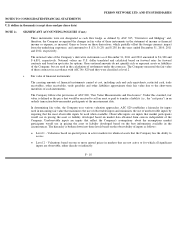
The carrying amounts of financial instruments carried at cost, including cash and cash equivalents, restricted cash, trade
receivables, other receivables, trade payables and other liabilities approximate their fair value due to the short-
term
maturities of such instruments.
The Company follows the provisions of ASC 820, "Fair Value Measurements and Disclosures". Under this standard, fair
value is defined as the price that would be received to sell an asset or paid to transfer a liability (i.e., the "exit price") in an
orderly transaction between market participants at the measurement date.
In determining fair value, the Company uses various valuation approaches. ASC 820 establishes a hierarchy for inputs
used in measuring fair value that maximizes the use of observable inputs and minimizes the use of unobservable inputs by
requiring that the most observable inputs be used when available. Observable inputs are inputs that market participants
would use in pricing the asset or liability developed based on market data obtained from sources independent of the
Company. Unobservable inputs are inputs that reflect the Company's assumptions
about the assumptions market
participants would use in pricing the asset or liability developed based on the best information available in the
circumstances. The hierarchy is broken down into three levels based on the observability of inputs as follows:
NOTE 2:
-
SIGNIFICANT ACCOUNTING POLICIES (Cont.)
s.
Fair value of financial instruments:
•
Level 1 -
Valuations based on quoted prices in active markets for identical assets that the Company has the ability to
access.
•
Level 2 -
Valuations based on one or more quoted prices in markets that are not active or for which all significant
inputs are observable, either directly or indirectly.
F
-
18