Incredimail 2014 Annual Report Download - page 49
Download and view the complete annual report
Please find page 49 of the 2014 Incredimail annual report below. You can navigate through the pages in the report by either clicking on the pages listed below, or by using the keyword search tool below to find specific information within the annual report.-
 1
1 -
2
-
3
-
4
-
5
-
6
-
7
-
8
-
9
-
10
-
11
-
12
-
13
-
14
-
15
-
16
-
17
-
18
-
19
-
20
-
21
-
22
-
23
-
24
-
25
-
26
-
27
-
28
-
29
-
30
-
31
-
32
-
33
-
34
-
35
-
36
-
37
-
38
-
 39
39 -
 40
40 -
 41
41 -
 42
42 -
 43
43 -
 44
44 -
 45
45 -
 46
46 -
 47
47 -
 48
48 -
 49
49 -
 50
50 -
 51
51 -
 52
52 -
 53
53 -
 54
54 -
 55
55 -
 56
56 -
 57
57 -
 58
58 -
 59
59 -
60
-
61
-
62
-
63
-
64
-
65
-
66
-
67
-
68
-
69
-
70
-
71
-
72
-
73
-
74
-
75
-
76
-
77
-
78
-
79
-
80
-
81
-
82
-
83
-
84
-
85
-
86
-
87
-
88
-
89
-
90
-
91
-
92
-
93
-
94
-
95
-
96
-
97
-
98
-
99
-
100
-
101
-
102
-
103
-
104
-
105
-
106
-
107
-
108
-
109
-
110
-
111
-
112
-
113
-
114
-
115
-
116
-
117
-
118
-
119
-
120
-
121
-
122
-
123
-
124
-
125
-
126
-
127
-
128
-
129
-
130
-
131
-
132
-
133
-
134
-
135
-
136
-
137
-
138
-
139
-
140
-
141
-
142
-
143
-
144
-
145
-
146
-
147
-
148
-
149
-
150
-
151
-
152
-
153
-
154
-
155
-
156
-
157
-
158
-
159
-
160
-
161
-
162
-
163
-
164
-
165
-
166
 |
 |
Advertising
. Advertising revenues increased by 142%, from $19.9 million in 2012 to $48.2 million in 2013. This increase is attributable
mainly to our offering to developers with the ability to easily incorporate ads into the download and installation process of their software,
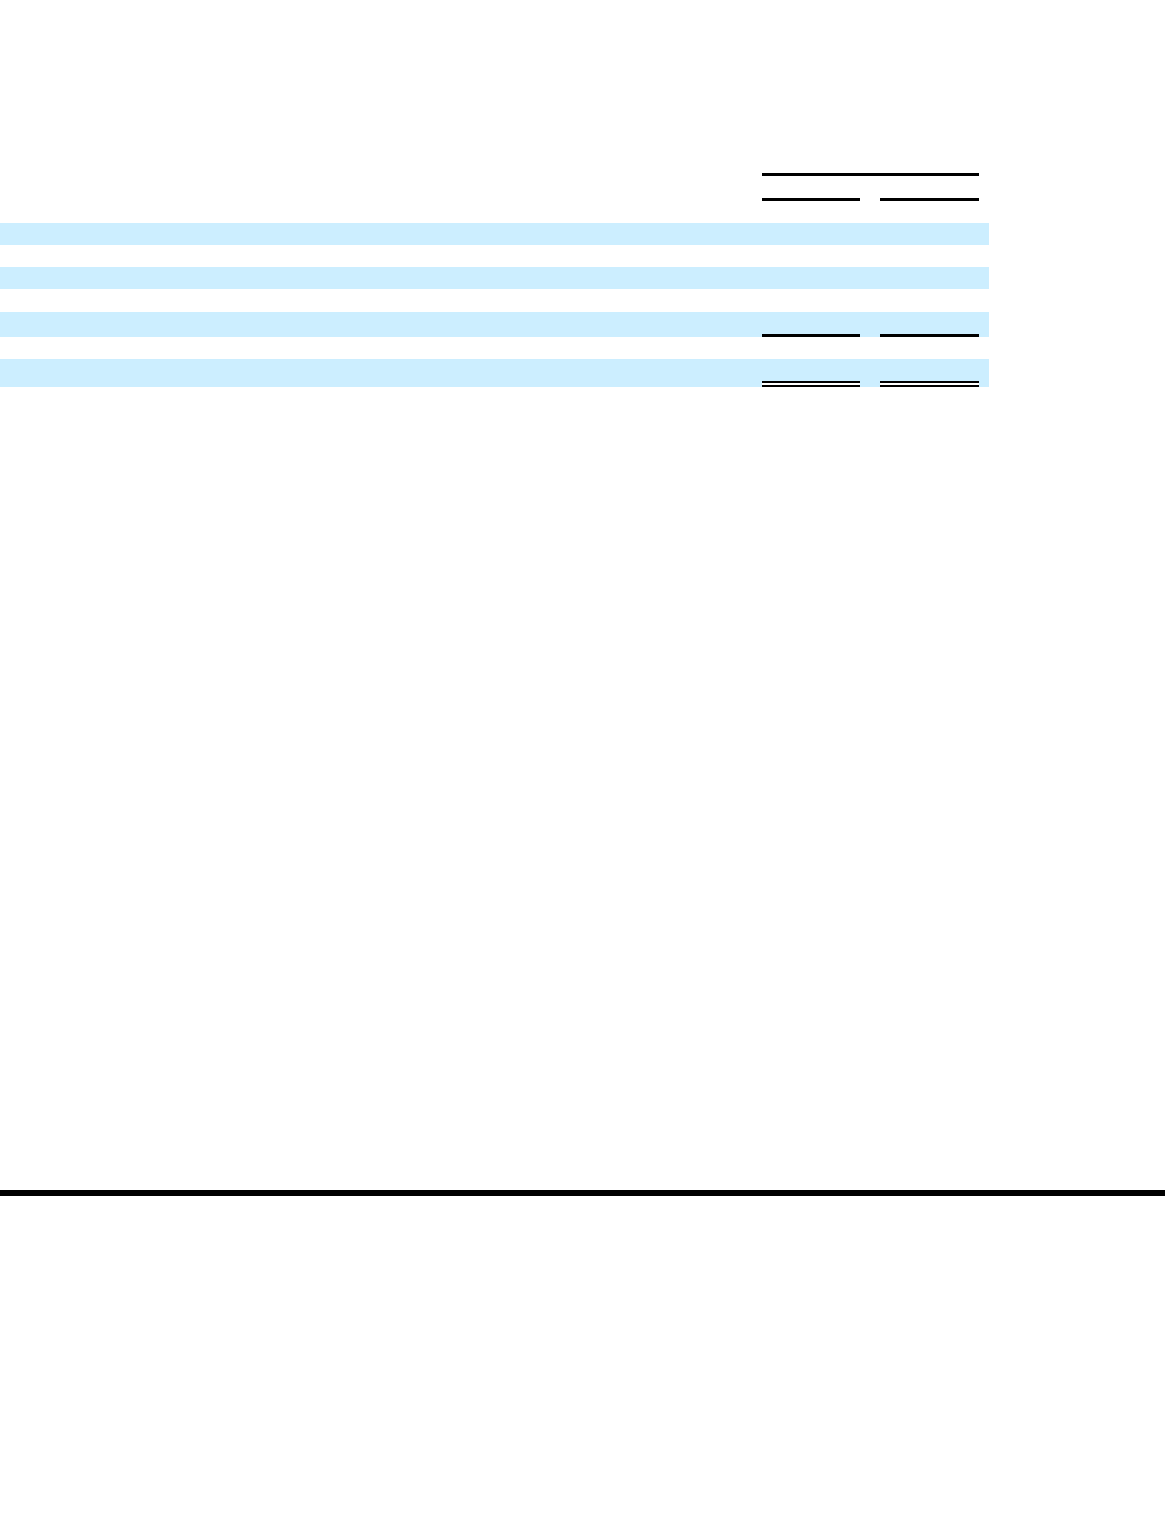
thereby further increasing monetization opportunities. The following table shows costs and expenses by category (in thousands of U.S. dollars):
Cost of revenues . Cost of revenues increased by 11% from $5.5 million in 2012, to $6.1 million in 2013.
Customer acquisition costs.
CAC increased by 55%, from $119.6 million in 2012, to $185.4 million in 2013. This increase reflected our
strategy to grow search-
generated revenues, leveraging our ability to analyze this investment and determine the expected positive return over the
coming year.
Research and development expenses
. R&D expenses increased by 33%, from $16.9 million in 2012, to $22.4 million in 2013. The
increase was as a result of our investing in enriching our product pipeline and addressing frequent changes in the Internet and PC platforms that
serve as a basis for our offering.
Selling and marketing expenses
. S&M expenses increased by 30%, from $7.9 million in 2012, to $10.3 million in 2013. The increase
was primarily due to an increase of $4.8 million in salaries and related expenses, as we increased our staff to generate a higher level of revenues.
General and administrative expenses.
G&A increased from $4.7 million in 2012, to $19.1 in 2013. This increase was primarily due to
$8.5 million increase in share based compensation expenses and $3.7 million in legal costs associated with the reorganization in regards to the
split of ClientConnect from Conduit and the acquisition of Perion compared to those expenses in the previous year.
Taxes on Income.
Income tax in 2013 was $22.6 million, compared to $75.4 million in 2012. While nominally taxes on income
declined, the effective income tax rate increased from 19% to 27%, primarily as a result of the significant increase in expenses not deductible for
tax purposes in 2013, particularly $8.8 million in employee stock-based compensation and $2.1 million of costs related to acquisition.
Net Income.
Net income in 2013 was $28.6 million, compared to $290.9 million in 2012. This decrease was primarily a result of the
significant decrease in revenues as described above.
B. LIQUIDITY AND CAPITAL RESOURCES
As of December 31, 2014, we had $101.2 million in cash and cash equivalents, compared to $0.9 million at December 31, 2013. The
low cash balance as of December 31, 2013, was due to the terms of the ClientConnect split from Conduit, pursuant which most of the cash
balances as of such date remained with Conduit. The increase in cash and cash equivalents in 2014 is the result of $72.0 million cash provided
by operating activities and $35.2 million from financing activities, mainly proceeds from the issuance of convertible debt, partially offset by $7.0
million of investing activities. We believe that our cash balances and cash generated from operations will be sufficient to meet our anticipated
cash requirements for operations for at least the next 12 months.
Year ended December
31,
2012
2013
Cost of revenues
$
5,513
$
6,104
Customer acquisition costs
119,555
185,355
Research and development
16,858
22,394
Selling and marketing
7,920
10,298
General and administrative
4,705
19,115
Total costs and expenses
$
154,551
$
243,266
44