Napa Auto Parts 2007 Annual Report Download - page 16
Download and view the complete annual report
Please find page 16 of the 2007 Napa Auto Parts annual report below. You can navigate through the pages in the report by either clicking on the pages listed below, or by using the keyword search tool below to find specific information within the annual report.-
 1
1 -
2
-
3
-
4
-
5
-
 6
6 -
 7
7 -
 8
8 -
 9
9 -
 10
10 -
 11
11 -
 12
12 -
 13
13 -
 14
14 -
 15
15 -
 16
16 -
 17
17 -
 18
18 -
 19
19 -
 20
20 -
 21
21 -
 22
22 -
 23
23 -
 24
24 -
 25
25 -
 26
26 -
27
-
28
-
29
-
30
-
31
-
32
-
33
-
34
-
35
-
36
-
37
-
38
-
39
-
40
-
41
-
42
-
43
-
44
-
45
-
46
-
47
-
48
 |
 |

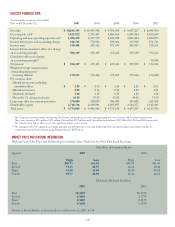
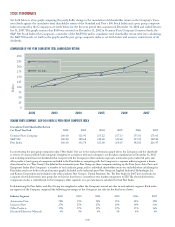
StockPerformance
Set forth below is a line graph comparing the yearly dollar change in the cumulative total shareholder return on the Company’s Com-
mon Stock against the cumulative total shareholder return of the Standard and Poor’s 500 Stock Index and a peer group composite
index structured by the Company as set forth below for the five year period that commenced December 31, 2002 and ended Decem-
ber 31, 2007. is graph assumes that $100 was invested on December 31, 2002 in Genuine Parts Company Common Stock, the
S&P 500 Stock Index (the Company is a member of the S&P 500, and its cumulative total shareholder return went into calculating
the S&P 500 results set forth in the graph) and the peer group composite index as set forth below and assumes reinvestment of all
dividends.
ComparisonofFiveYearCumulativeTotalShareholderReturn
2002 2003 2004 2005 2006 2007
250
225
200
175
150
125
100
75
50
25
0
GenuinePartsCompany,S&P500Index&PeerGroupCompositeIndex
In constructing the peer group composite index (“Peer Index”) for use in the stock performance graph above, the Company used the sharehold-
er returns of various publicly held companies (weighted in accordance with each company’s stock market capitalization at December 31, 2002
and including reinvestment of dividends) that compete with the Company in three industry segments: automotive parts, industrial parts and
office products (each group of companies included in the Peer Index as competing with the Company in a separate industry segment is herein-
after referred to as a “Peer Group”). Included in the automotive parts Peer Group are those companies making up the Dow Jones Auto Parts and
Equipment Index (the Company is a member of such industry group, and its individual shareholder return was included when calculating the
Peer Index results set forth in the performance graph). Included in the industrial parts Peer Group are Applied Industrial Technologies, Inc.
and Kaman Corporation and included in the office products Peer Group is United Stationers Inc. e Peer Index for 2007 does not break out
a separate electrical/electronic peer group due to that fact that there is currently no true market comparative to EIS. e electrical/electronic
component of sales is redistributed to the Company’s other segments on a pro rata basis to calculate the final Peer Index.
In determining the Peer Index, each Peer Group was weighted to reflect the Company’s annual net sales in each industry segment. Each indus-
try segment of the Company comprised the following percentages of the Company’s net sales for the fiscal years shown:
Cumulative Total Shareholder Return
$ at Fiscal Year End 2002 2003 2004 2005 2006 2007
Genuine Parts Company 100.00 111.93 153.22 157.13 175.01 176.03
S&P 500 100.00 128.68 142.68 149.69 173.32 182.84
Peer Index 100.00 136.78 162.00 168.67 192.02 226.95
Industry Segment 2002 2003 2004 2005 2006 2007
Automotive Parts 52% 53% 52% 51% 49% 49%
Industrial Parts 27% 27% 27% 29% 30% 31%
Office Products 17% 17% 17% 17% 17% 16%
Electrical/Electronic Materials 4% 3% 4% 3% 4% 4%
Dollars
14
Genuine Parts Company
S&P Index
Peer Index