Neiman Marcus 2003 Annual Report Download - page 49
Download and view the complete annual report
Please find page 49 of the 2003 Neiman Marcus annual report below. You can navigate through the pages in the report by either clicking on the pages listed below, or by using the keyword search tool below to find specific information within the annual report.-
 1
1 -
2
-
3
-
4
-
5
-
6
-
7
-
8
-
9
-
10
-
11
-
12
-
13
-
14
-
15
-
16
-
17
-
18
-
19
-
20
-
21
-
22
-
23
-
24
-
25
-
26
-
27
-
28
-
29
-
30
-
31
-
32
-
33
-
34
-
35
-
36
-
37
-
38
-
 39
39 -
 40
40 -
 41
41 -
 42
42 -
 43
43 -
 44
44 -
 45
45 -
 46
46 -
 47
47 -
 48
48 -
 49
49 -
 50
50 -
 51
51 -
 52
52 -
 53
53 -
 54
54 -
 55
55 -
 56
56 -
 57
57 -
 58
58 -
 59
59 -
60
-
61
-
62
-
63
-
64
-
65
-
66
-
67
-
68
-
69
-
70
-
71
-
72
-
73
-
74
-
75
-
76
-
77
-
78
-
79
-
80
-
81
-
82
-
83
-
84
-
85
-
86
-
87
-
88
-
89
-
90
-
91
-
92
-
93
-
94
-
95
-
96
-
97
-
98
-
99
-
100
-
101
-
102
-
103
-
104
-
105
-
106
-
107
-
108
-
109
-
110
-
111
-
112
-
113
-
114
-
115
-
116
-
117
-
118
-
119
-
120
-
121
-
122
-
123
-
124
-
125
-
126
-
127
-
128
-
129
-
130
-
131
-
132
-
133
-
134
-
135
-
136
-
137
-
138
-
139
-
140
-
141
-
142
-
143
-
144
-
145
-
146
-
147
-
148
-
149
-
150
-
151
-
152
-
153
-
154
-
155
-
156
-
157
-
158
-
159
-
160
-
161
-
162
-
163
-
164
-
165
-
166
-
167
-
168
-
169
-
170
-
171
-
172
-
173
-
174
-
175
-
176
-
177
-
178
-
179
-
180
-
181
-
182
-
183
-
184
-
185
-
186
-
187
-
188
-
189
-
190
-
191
-
192
-
193
-
194
-
195
-
196
-
197
-
198
-
199
-
200
-
201
-
202
-
203
-
204
-
205
-
206
-
207
-
208
-
209
-
210
-
211
-
212
-
213
-
214
-
215
-
216
-
217
-
218
-
219
-
220
-
221
-
222
-
223
-
224
-
225
-
226
-
227
-
228
-
229
-
230
-
231
-
232
-
233
-
234
-
235
-
236
-
237
-
238
-
239
-
240
-
241
-
242
-
243
-
244
-
245
-
246
-
247
-
248
-
249
-
250
-
251
-
252
-
253
-
254
-
255
-
256
-
257
-
258
-
259
-
260
-
261
-
262
-
263
-
264
-
265
-
266
-
267
-
268
-
269
-
270
-
271
-
272
-
273
-
274
-
275
-
276
-
277
-
278
-
279
-
280
-
281
-
282
-
283
-
284
-
285
-
286
-
287
-
288
-
289
-
290
-
291
-
292
-
293
-
294
-
295
-
296
-
297
-
298
-
299
-
300
-
301
-
302
-
303
-
304
-
305
-
306
-
307
-
308
-
309
-
310
-
311
-
312
-
313
-
314
-
315
-
316
-
317
-
318
-
319
-
320
-
321
-
322
-
323
-
324
-
325
-
326
-
327
-
328
-
329
-
330
-
331
-
332
-
333
-
334
-
335
-
336
-
337
-
338
-
339
-
340
-
341
-
342
-
343
-
344
-
345
-
346
-
347
-
348
-
349
-
350
-
351
-
352
-
353
-
354
-
355
-
356
-
357
 |
 |

Significant assumptions related to the calculation of the Company's obligations include the discount rate used to calculate the actuarial
present value of benefit obligations to be paid in the future, the expected long-term rate of return on assets held by the Pension Plan
and the average rate of compensation increase by plan participants. These actuarial assumptions are reviewed annually based upon
currently available information.
Self-insurance and Other Employee Benefit Reserves. Management uses estimates in the determination of the required accruals for
general liability, workers' compensation and health insurance as well as short-term disability, supplemental executive retirement
benefits and postretirement health care benefits. These estimates are based upon an examination of historical trends, industry claims
experience and, in certain cases, calculations performed by third-party experts. Projected claims information may change in the future
and may require management to revise these accruals.
Other Long-term Liabilities. Other long-term liabilities consist primarily of certain employee benefit obligations, postretirement
health care benefit obligations and the liability for scheduled rent increases.
Revenues. Revenues include sales of merchandise and services, net commissions earned from leased departments in the Company's
retail stores and shipping and handling revenues related to merchandise sold. Revenues from the Company's retail operations are
recognized at the later of the point of sale or the delivery of goods to the customer. Revenues from the Company's direct marketing
operation are recognized when the merchandise is delivered to the customer.
The Company maintains reserves for anticipated sales returns primarily based on the Company's historical trends related to returns by
its retail and direct marketing customers.
Buying and Occupancy Costs. The Company's buying costs consist primarily of salaries and expenses incurred by the Company's
merchandising and buying operations. Occupancy costs primarily include rent, depreciation, property taxes and operating costs of the
Company's retail and distribution facilities.
Selling, General and Administrative Expenses. Selling, general and administrative expenses are comprised principally of the costs
related to employee compensation and benefits in the selling and administrative support areas, preopening expenses, advertising and
catalog costs, loyalty program costs, insurance expense and income and expenses related to the Company's proprietary credit card
portfolio.
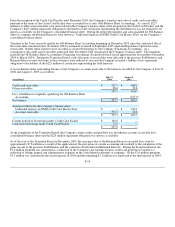
The Company receives allowances from certain merchandise vendors in conjunction with compensation programs for employees who
sell the vendors' merchandise. These allowances are netted against the related compensation expense incurred by the Company.
Amounts received from vendors related to compensation programs were $46.3 million in 2004, $41.1 million in 2003 and $37.0
million in 2002.
Preopening Expenses. Preopening expenses primarily consist of payroll and related media costs incurred in connection with new and
replacement store openings and are expensed when incurred. The Company opened no new stores in 2004 and had no preopening
expenses in 2004. Preopening expenses were $8.0 million for 2003 and $5.2 million for 2002.
Advertising and Catalog Costs. The Company incurs costs to advertise and promote the merchandise assortment offered by both
Specialty Retail Stores and Direct Marketing. Advertising costs incurred by the Specialty Retail Stores consist primarily of print
media costs related to promotional materials mailed to its customers. These costs are expensed at the time of mailing to the customer.
Advertising costs incurred by Direct Marketing relate to the production, printing and distribution of its print catalogs and the
production of the photographic content on its websites. The costs of print catalogs are amortized during the periods the expected
revenues from such catalogs are expected to be generated, generally three to six months. The costs incurred to produce the
photographic content on the Company's websites are expensed at the time the images are first loaded onto the website. Website
design costs are expensed as incurred.
Deferred direct response advertising amounts included in other current assets in the consolidated balance sheets were $10.3 million as
of July 31, 2004 and $11.0 million as of August 2, 2003. Net advertising expenses were $125.0 million in 2004, $113.7 million in
2003 and $110.3 million in 2002.
F-10