Pfizer 2005 Annual Report Download - page 13
Download and view the complete annual report
Please find page 13 of the 2005 Pfizer annual report below. You can navigate through the pages in the report by either clicking on the pages listed below, or by using the keyword search tool below to find specific information within the annual report.-
 1
1 -
2
-
 3
3 -
 4
4 -
 5
5 -
 6
6 -
 7
7 -
 8
8 -
 9
9 -
 10
10 -
 11
11 -
 12
12 -
 13
13 -
 14
14 -
 15
15 -
 16
16 -
 17
17 -
 18
18 -
 19
19 -
 20
20 -
 21
21 -
 22
22 -
 23
23 -
24
-
25
-
26
-
27
-
28
-
29
-
30
-
31
-
32
-
33
-
34
-
35
-
36
-
37
-
38
-
39
-
40
-
41
-
42
-
43
-
44
-
45
-
46
-
47
-
48
-
49
-
50
-
51
-
52
-
53
-
54
-
55
-
56
-
57
-
58
-
59
-
60
-
61
-
62
-
63
-
64
-
65
-
66
-
67
-
68
-
69
-
70
-
71
-
72
-
73
-
74
-
75
 |
 |

12 2005 Financial Report
Financial Review
Pfizer Inc and Subsidiary Companies
Our accruals for Medicaid rebates, contract rebates and
chargebacks totaled $1.8 billion and $1.7 billion at December 31,
2005 and 2004.
Revenues by Business Segment
We operate in the following business segments:
•Human Health
—The Human Health segment, which represents our
pharmaceutical business, includes treatments for cardiovascular
and metabolic diseases, central nervous system disorders,
arthritis and pain, infectious and respiratory diseases,
urogenital conditions, cancer, eye disease, endocrine disorders
and allergies.
•Consumer Healthcare
—The Consumer Healthcare segment includes self-medications
for oral care, upper-respiratory health, tobacco dependence,
gastrointestinal health, skin care, eye care and hair growth.
•Animal Health
—The Animal Health segment includes treatments for diseases
in livestock and companion animals.
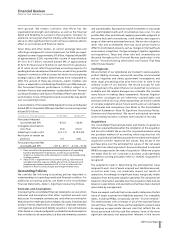
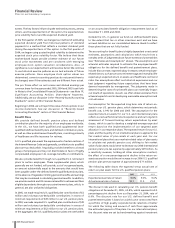
Total Revenues by Business Segment
86.3% 87.8% 88.1%
7.6%
4.3% 1.8%
6.7%
3.7% 1.8%
6.6%
3.6%1.7%
2005 2004 2003
HUMAN HEALTH ANIMAL HEALTH
CONSUMER HEALTHCARE CORPORATE/OTHER
Change in Geographic Revenues
YEAR ENDED DEC. 31, % CHANGE
U.S. INTERNATIONAL U.S. INTERNATIONAL
(MILLIONS OF DOLLARS) 2005 2004 2003 2005 2004 2003 05/04 04/03 05/04 04/03
Revenues:
Human Health $23,443 $26,583 $24,100 $20,841 $19,550 $15,325 (12) 10 728
Consumer Healthcare
1,941 1,780 1,649 1,937 1,736 1,300 9812 34
Animal Health 993 878 738 1,213 1,075 860 13 19 13 25
Other 287 298 308 643 616 456 (4) (3) 435
Total Revenues $26,664 $29,539 $26,795 $24,634 $22,977 $17,941 (10) 10 728
Human Health
Revenues of our Human Health segment were as follows:
YEAR ENDED DEC. 31, % CHANGE
__________________________________________ _________________
(MILLIONS OF DOLLARS) 2005 2004 2003 05/04 04/03
Human Health $44,284 $46,133 $39,425 (4) 17
Our pharmaceutical business is the largest in the world. Revenues
from this segment contributed 86% of our total revenues in 2005
and 88% in each of 2004 and 2003. At the end of 2005, six of our
pharmaceutical products were number one in their respective
therapeutic categories based on revenue.
We recorded product sales of more than $1 billion for each of
eight products in 2005, each of ten products in 2004 and each of
nine products in 2003. These products represented 64% in 2005,
69% in 2004 and 70% in 2003 of our Human Health business.
In 2005, Human Health revenues declined. The loss of U.S.
exclusivity on certain key products (primarily Neurontin) has
resulted in a decline in 2005 worldwide revenues for those
products of approximately $2.8 billion in comparison to 2004. In
addition, the uncertainty and patient concerns relating to selective
COX-2 inhibitors and the suspension of sales of Bextra have
resulted in a decline in our selective COX-2 inhibitor worldwide
revenues of $2.9 billion (down 63%) in comparison to 2004.
Despite these events, we were able to offset approximately $4.0
billion of those declines through our in-line products coupled with
new product launches.
2005 was also impacted by increased competition and the overall
market decline as branded prescriptions in the U.S. declined 5%
in 2005 compared to 2004. An example is the erectile-dysfunction
market, with total prescriptions declining 3% in 2005 versus 10%
growth in 2004. The second half of 2005 also exhibited significant
change in growth trends relative to the first half of the year in a
number of U.S. therapeutic markets.
Effective January 1, 2006, January 1, 2005 and January 2, 2004, we
increased the published prices for certain U.S. pharmaceutical
products. These price increases had no material effect on
wholesaler inventory levels in comparison to the prior year.