Pfizer 2010 Annual Report Download - page 4
Download and view the complete annual report
Please find page 4 of the 2010 Pfizer annual report below. You can navigate through the pages in the report by either clicking on the pages listed below, or by using the keyword search tool below to find specific information within the annual report.-
 1
1 -
 2
2 -
 3
3 -
 4
4 -
 5
5 -
 6
6 -
 7
7 -
 8
8 -
 9
9 -
 10
10 -
 11
11 -
 12
12 -
 13
13 -
 14
14 -
 15
15 -
16
-
17
-
18
-
19
-
20
-
21
-
22
-
23
-
24
-
25
-
26
-
27
-
28
-
29
-
30
-
31
-
32
-
33
-
34
-
35
-
36
-
37
-
38
-
39
-
40
-
41
-
42
-
43
-
44
-
45
-
46
-
47
-
48
-
49
-
50
-
51
-
52
-
53
-
54
-
55
-
56
-
57
-
58
-
59
-
60
-
61
-
62
-
63
-
64
-
65
-
66
-
67
-
68
-
69
-
70
-
71
-
72
-
73
-
74
-
75
-
76
-
77
-
78
-
79
-
80
-
81
-
82
-
83
-
84
-
85
-
86
-
87
-
88
-
89
-
90
-
91
-
92
-
93
-
94
-
95
-
96
-
97
-
98
-
99
-
100
-
101
-
102
-
103
-
104
-
105
-
106
-
107
-
108
-
109
-
110
-
111
-
112
-
113
-
114
-
115
-
116
-
117
-
118
-
119
-
120
 |
 |

Financial Review
Pfizer Inc. and Subsidiary Companies
Overview of Our Performance, Operating Environment, Strategy and Outlook
Our Business
Our mission is to apply science and our global resources to improve health and well-being at every stage of life. We strive to set the
standard for quality, safety and value in the discovery, development and manufacturing of medicines for people and animals. Our
diversified global healthcare portfolio includes human and animal biologic and small molecule medicines and vaccines, as well as
nutritional products and many of the world’s best-known consumer products. Every day, we work across developed and emerging
markets to advance wellness, prevention, treatments and cures that challenge the most feared diseases of our time. We also
collaborate with other biopharmaceutical companies, healthcare providers, governments and local communities to support and
expand access to reliable, affordable healthcare around the world. Our revenues are derived from the sale of our products, as well
as through alliance agreements, under which we co-promote products discovered by other companies.
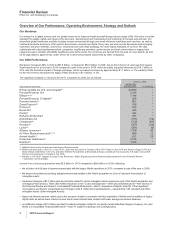
Our 2010 Performance
Revenues increased 36% in 2010 to $67.8 billion, compared to $50.0 billion in 2009, due to the inclusion of revenues from legacy
Wyeth products for a full year in 2010 compared to part of the year in 2009, which favorably impacted revenues by $18.1 billion or
37%, and the favorable impact of foreign exchange, which increased revenues by approximately $1.1 billion, or 2%, partially offset
by the net revenue decrease from legacy Pfizer products of $1.4 billion, or 3%.
The significant impacts on revenues for 2010, compared to 2009, are as follows:
2010 vs. 2009
(MILLIONS OF DOLLARS)
INCREASE/
(DECREASE) % CHANGE
Enbrel (outside the U.S. and Canada)(a) $2,896 *
Prevnar/Prevenar 13(a) 2,416 *
Effexor(a), (b) 1,198 *
Prevnar/Prevenar (7-valent)(a) 966 *
Premarin family(a) 827 *
Zosyn/Tazocin(a) 768 *
Protonix(a) 622 *
BeneFIX(a) 545 *
Pristiq(a) 384 *
ReFacto AF/Xyntha(a) 357 *
Detrol/Detrol LA (141) (12)
Camptosar(b) (215) (64)
Norvasc(b) (467) (24)
Lipitor(b) (701) (6)
Alliance revenues(a) 1,159 40
All Other Biopharmaceutical(a), (c) 890 12
Animal Health(a) 811 29
Consumer Healthcare(a) 2,278 *
Nutrition(a) 1,676 *
(a) Reflects the inclusion of revenues from legacy Wyeth products.
(b) Effexor lost exclusivity in the U.S. in July 2010. Lipitor lost exclusivity in Canada in May 2010, Spain in July 2010 and Brazil in August 2010 and
faces intense competition in the U.S. and other markets from generic and branded products. Camptosar lost exclusivity in Europe in July 2009.
Norvasc lost exclusivity in Canada in July 2009.
(c) Relates to “All Other” category included in the Revenues—Major Biopharmaceutical Products table presented in this Financial Review.
* Calculation not meaningful.
Income from continuing operations was $8.3 billion in 2010 compared to $8.6 billion in 2009, reflecting:
•the inclusion of a full year of expenses associated with the legacy Wyeth operations in 2010, compared to part of the year in 2009;
•the impact of purchase accounting adjustments primarily related to the Wyeth acquisition on Cost of sales and Amortization of
intangible assets;
•impairment charges of $2.1 billion (pre-tax) primarily related to certain intangible assets acquired as part of the Wyeth acquisition and
one legacy Pfizer product, Thelin (see further discussion in the “Costs and Expenses––Other (Income)/Deductions––Net” section of
this Financial Review and Notes to Consolidated Financial Statements—Note 2. Acquisition of Wyeth,Note 3B. Other Significant
Transactions and Events: Asset Impairment Charges, Note 6. Other (Income)/Deductions––net and Note 12B. Goodwill and Other
Intangible Assets: Other Intangible Assets);
•higher net interest expense, mainly due to the issuance of debt in connection with the acquisition of Wyeth and the addition of legacy
Wyeth debt, as well as lower interest income due to lower interest rates coupled with lower average investment balances;
•an additional charge of $1.3 billion (pre-tax) for asbestos litigation related to our wholly owned subsidiary Quigley Company, Inc. (see
Notes to Consolidated Financial Statements––Note 19. Legal Proceedings and Contingencies);
2 2010 Financial Report