Pier 1 2009 Annual Report Download - page 35
Download and view the complete annual report
Please find page 35 of the 2009 Pier 1 annual report below. You can navigate through the pages in the report by either clicking on the pages listed below, or by using the keyword search tool below to find specific information within the annual report.-
 1
1 -
2
-
3
-
4
-
5
-
6
-
7
-
8
-
9
-
10
-
11
-
12
-
13
-
14
-
15
-
16
-
17
-
18
-
19
-
20
-
21
-
22
-
23
-
24
-
 25
25 -
 26
26 -
 27
27 -
 28
28 -
 29
29 -
 30
30 -
 31
31 -
 32
32 -
 33
33 -
 34
34 -
 35
35 -
 36
36 -
 37
37 -
 38
38 -
 39
39 -
 40
40 -
 41
41 -
 42
42 -
 43
43 -
 44
44 -
 45
45 -
46
-
47
-
48
-
49
-
50
-
51
-
52
-
53
-
54
-
55
-
56
-
57
-
58
-
59
-
60
-
61
-
62
-
63
-
64
-
65
-
66
-
67
-
68
-
69
-
70
-
71
-
72
-
73
-
74
-
75
-
76
-
77
-
78
-
79
-
80
-
81
-
82
-
83
-
84
-
85
-
86
-
87
-
88
-
89
-
90
-
91
-
92
-
93
-
94
-
95
-
96
-
97
-
98
-
99
-
100
-
101
-
102
-
103
-
104
-
105
-
106
-
107
-
108
-
109
-
110
-
111
-
112
-
113
-
114
-
115
-
116
-
117
-
118
-
119
-
120
-
121
-
122
-
123
-
124
-
125
-
126
-
127
-
128
-
129
-
130
-
131
-
132
-
133
-
134
-
135
-
136
-
137
-
138
-
139
-
140
-
141
-
142
-
143
-
144
-
145
-
146
-
147
-
148
-
149
-
150
-
151
-
152
-
153
-
154
-
155
-
156
-
157
-
158
-
159
-
160
-
161
-
162
-
163
-
164
-
165
-
166
-
167
-
168
-
169
-
170
-
171
-
172
-
173
 |
 |
$3.3 million increase in severance and outplacement costs in fiscal 2008 associated primarily with home
office and field administration headcount reductions during the first two quarters of the year.
Impairment charges decreased $31.4 million as a result of less impairment recorded during fiscal 2008,
and lease termination obligations increased $6.4 million related primarily to the closure of all Pier 1
Kids and clearance stores during fiscal 2008. Litigation settlements decreased $4.9 million as a result of
a $4.6 million charge in fiscal 2007 related to an accrual for the settlement of a class action lawsuit
with no similar expense in fiscal 2008. Other selling, general and administrative expenses that do not
typically vary with sales decreased primarily as a result of the Company’s continued initiative to manage
and control expenses.
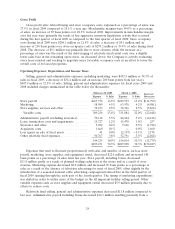
Depreciation and amortization for fiscal 2008 was $39.8 million, representing a decrease of
approximately $11.4 million from fiscal 2007 depreciation and amortization expense of $51.2 million.
This decrease was primarily the result of lower net book values on certain store-level long-lived assets
because of impairment charges taken during and since the end of fiscal 2007, certain assets’ becoming
fully depreciated, store closures, and lower capital expenditures.
In fiscal 2008, the Company recorded an operating loss of $88.1 million compared to
$226.2 million for fiscal 2007.
During fiscal 2008, the Company recorded a $1.8 million charge to tax expense to adjust its federal
and state income tax refunds estimated at fiscal 2007 year end to the actual tax refunds filed for. The
federal tax benefit was entirely offset by provision of a full valuation allowance on the deferred assets
arising from the benefit, and only minimal state and foreign tax provisions were recorded on results for
fiscal 2008. Net deferred tax assets of $125.7 million were fully reserved at fiscal 2008 year end through
a valuation allowance. The Company had tax loss carryforwards of approximately $203.0 million. These
loss carryforwards have expirations beginning in fiscal year 2027.
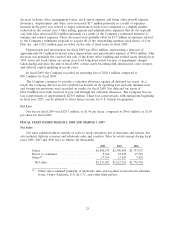
Net Loss
Net loss in fiscal 2008 was $96.0 million or $1.09 per share, an improvement of $131.6 million
when compared to fiscal 2007’s net loss (including discontinued operations) of $227.6 million, or $2.60
per share. See Note 12 of the Notes to Consolidated Financial Statements for additional information
regarding discontinued operations in fiscal 2007.
LIQUIDITY AND CAPITAL RESOURCES
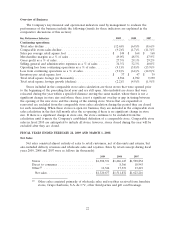
The Company’s cash and cash equivalents totaled $155.8 million at the end of fiscal 2009, an
increase of $62.4 million from the fiscal 2008 year end balance of $93.4 million. Operating activities
used $31.6 million primarily as a result of the Company’s net loss, a reduction in accounts payable and
accrued expenses, and an increase in accounts receivable, prepaid expenses and other current assets.
These operating outflows were partially offset by a reduction in inventory and the collection of a
federal income tax refund, including related interest.
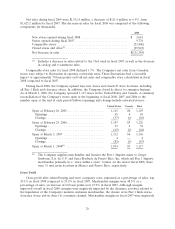
Inventory levels at the end of fiscal 2009 were $316.3 million, down $95.4 million, or 23.2% from
inventory levels at the end of fiscal 2008. At the end of fiscal 2009, inventory per retail square foot was
$37 compared to $47 a year ago. The decrease from fiscal 2008 year end was due in part to a
conservative plan for the first six months of fiscal 2010 and a planned decline in inventory levels at the
distribution centers as the Company continued to shift inventory to the stores. This allowed the
Company to exit approximately 350,000 square feet of outside distribution center space during the
second quarter of fiscal 2009. In addition, the Company plans to exit approximately 514,000 square feet
of additional distribution center space by closing its Chicago distribution center during the first quarter
of fiscal 2010. The Company continues to focus on managing inventory levels and is closely monitoring
the timing and appropriate levels of merchandise purchases to keep inventory in line with consumer
28