Qantas 2000 Annual Report Download - page 9
Download and view the complete annual report
Please find page 9 of the 2000 Qantas annual report below. You can navigate through the pages in the report by either clicking on the pages listed below, or by using the keyword search tool below to find specific information within the annual report.-
 1
1 -
 2
2 -
 3
3 -
 4
4 -
 5
5 -
 6
6 -
 7
7 -
 8
8 -
 9
9 -
 10
10 -
 11
11 -
 12
12 -
 13
13 -
 14
14 -
 15
15 -
 16
16 -
 17
17 -
 18
18 -
 19
19 -
 20
20 -
21
-
22
-
23
-
24
-
25
-
26
-
27
-
28
-
29
-
30
-
31
-
32
-
33
-
34
-
35
-
36
-
37
-
38
-
39
-
40
-
41
-
42
-
43
-
44
-
45
-
46
-
47
-
48
-
49
-
50
-
51
-
52
 |
 |
7
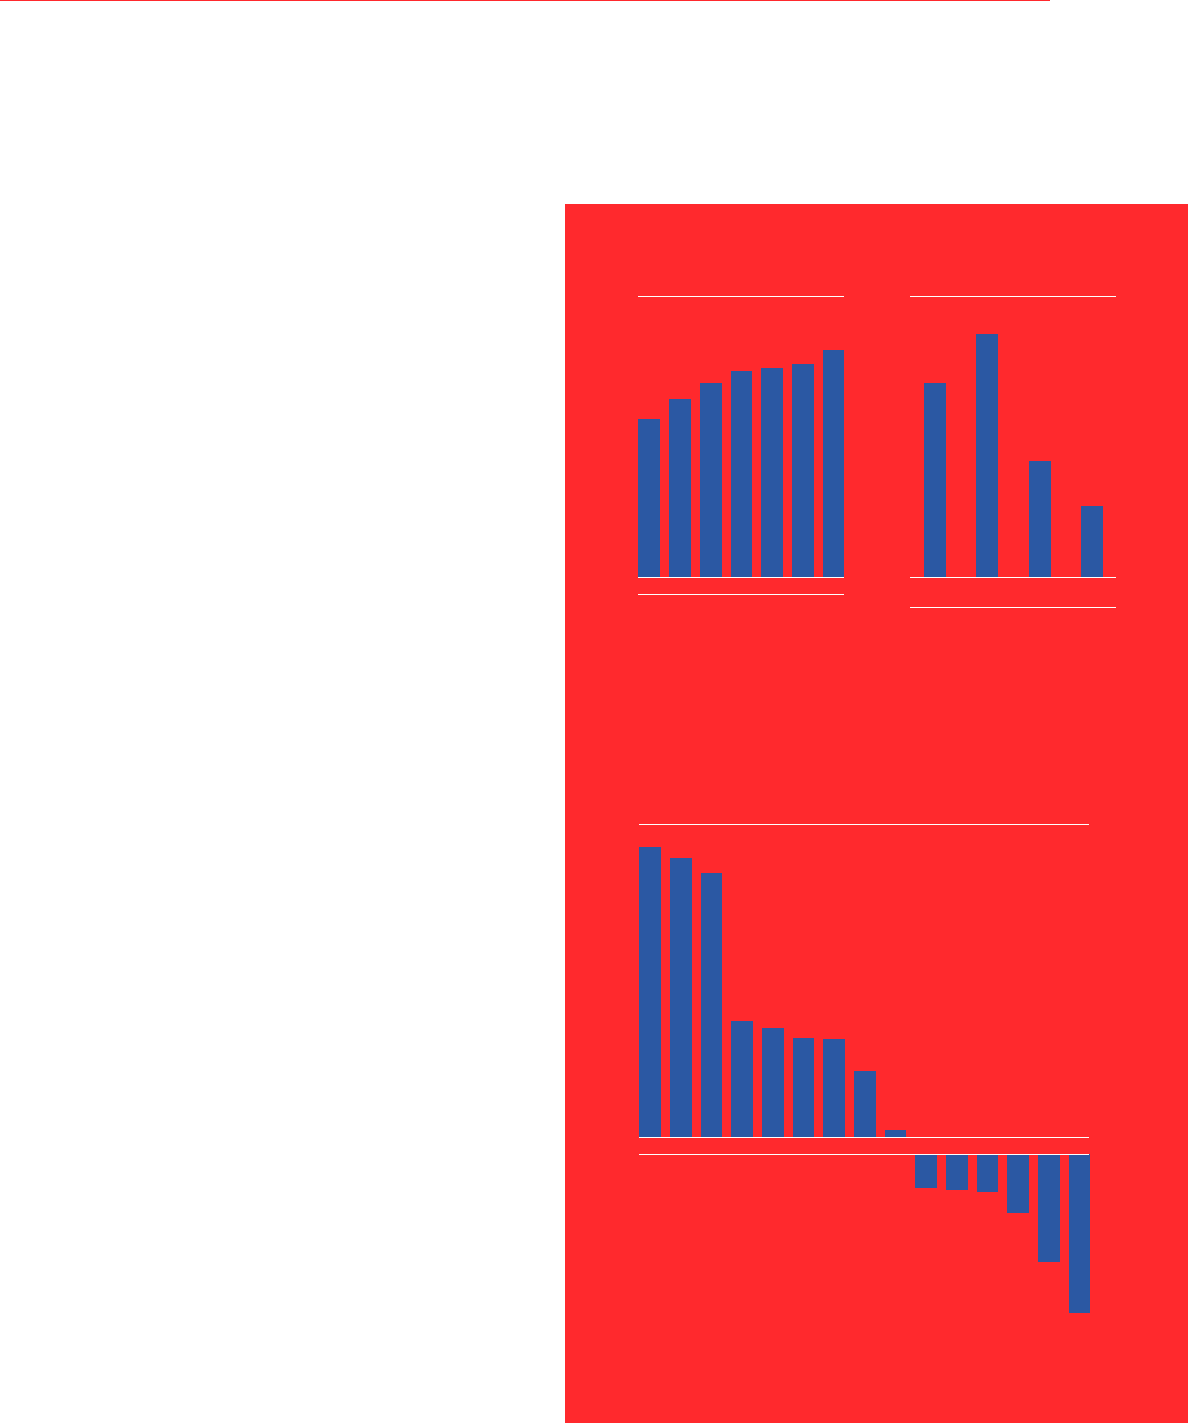
Qantas Shareholder Return vs Selected Airlines (%)
From float to 30 June 2000.
Source: Bloomberg.
Shareholder return: Includes share price appreciation and dividends.
Airline Definitions
QF Qantas
SQ Singapore Airlines
LH Lufthansa
AA American Airlines
UA United Airlines
KL KLM
CX Cathay Pacific
DL Delta Airlines
BA British Airways
TG Thai Airways
NW Northwest Airlines
NZ Air New Zealand
JL Japan Airlines
MH Malaysian Airlines
CP Canadian Airlines
154 147
140
62 58 53 52
35
4
(18) (19) (20)
(31)
(57)
(84)
SQ LH QF AA UA KL CX DL BA TG NW NZ JL MH CP
Passenger Numbers
(000)
94 95 96 97 98 99 00
14,252
16,054
17,486
18,606
18,865
19,236
20,485
Qantas Shareholder Return
vs Selected ASX Indices (%)
QF Transport
Index
All
Industrials
All
Ordinaries
140
175
84
51
From float to 30 June 2000.
EXPENDITURE
"
Operating expenditure $8,290.6 million, up 7 percent
(1999: $7,746.9 million).
"
Net interest expense $111.2 million, up 11.1 percent
(1999: $100.1 million).
"
Expenditure rose due to the additional costs associated
with higher revenue and additional capacity.
"
Depreciation, lease and interest costs rose due to further
investment in aircraft, terminals, product and services.
OPERATIONAL PERFORMANCE
"
Passengers carried 20.5 million, up 6.5 percent
(1999: 19.2 million).
"
Revenue passenger kilometres (RPKs) 64.1 billion,
up 7.2 percent (1999: 59.9 billion).
"
Available seat kilometres (ASKs) 85 billion,
up 4 percent (1999: 81.8 billion).
"
Revenue seat factor 75.4 percent, up 2.2 percentage
points (1999: 73.2 percent).
"
Yield 10.87 cents per RPK, up 1.1 percent
(1999: 10.75 cents per RPK).
"
Average full-time equivalent employees 29,217,
up 3.5 percent (1999: 28,226).
"
RPKs per employee of 2,196,000, up 3.5 percent
(1999: 2,121,000).
BALANCE SHEETS
"
Gearing (including notional capitalisation of
non-cancellable leases) 44:56, up 5 percentage
points (1999: 39:61) primarily due to the special
dividend and inclusion of all aircraft leases.
"
Net operating cash flow $1,599.8 million, up
32.4 percent (1999: $1,208.3 million).
"
Capital expenditure $1,141.8 million, predominantly
related to aircraft acquisitions, aircraft reconfiguration
costs, engine modifications and spares.
"
Dividend Reinvestment Plan to be reintroduced prior
to the payment of the special dividend.
GROWTH IN PASSENGER
NUMBERS WAS MAINTAINED
SHAREHOLDER RETURNS
SINCE FLOAT ARE 2.7 TIMES
GREATER THAN THE ALL
ORDINARIES OVER THE
SAME PERIOD
STRONG SHAREHOLDER RETURNS WITHIN
OUR INDUSTRY GROUP