Rite Aid 2013 Annual Report Download - page 31
Download and view the complete annual report
Please find page 31 of the 2013 Rite Aid annual report below. You can navigate through the pages in the report by either clicking on the pages listed below, or by using the keyword search tool below to find specific information within the annual report.-
 1
1 -
2
-
3
-
4
-
5
-
6
-
7
-
8
-
9
-
10
-
11
-
12
-
13
-
14
-
15
-
16
-
17
-
18
-
19
-
20
-
 21
21 -
 22
22 -
 23
23 -
 24
24 -
 25
25 -
 26
26 -
 27
27 -
 28
28 -
 29
29 -
 30
30 -
 31
31 -
 32
32 -
 33
33 -
 34
34 -
 35
35 -
 36
36 -
 37
37 -
 38
38 -
 39
39 -
 40
40 -
 41
41 -
42
-
43
-
44
-
45
-
46
-
47
-
48
-
49
-
50
-
51
-
52
-
53
-
54
-
55
-
56
-
57
-
58
-
59
-
60
-
61
-
62
-
63
-
64
-
65
-
66
-
67
-
68
-
69
-
70
-
71
-
72
-
73
-
74
-
75
-
76
-
77
-
78
-
79
-
80
-
81
-
82
-
83
-
84
-
85
-
86
-
87
-
88
-
89
-
90
-
91
-
92
-
93
-
94
-
95
-
96
-
97
-
98
-
99
-
100
-
101
-
102
-
103
-
104
-
105
-
106
-
107
-
108
-
109
-
110
-
111
-
112
-
113
-
114
-
115
-
116
-
117
-
118
-
119
-
120
-
121
-
122
-
123
-
124
-
125
 |
 |
Additionally, pharmacy gross margin improved due to significant recent generic introductions, partially
offset by continued reimbursement rate pressure.
Front end gross profit was slightly lower due to higher tier discounts from our wellness + customer
loyalty program and other markdowns, partially offset by increased sales. Front end gross margin was
flat to the prior year.
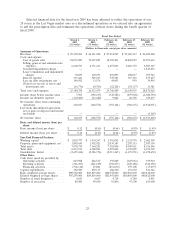
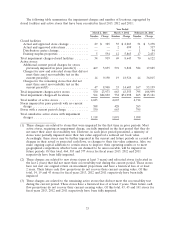
Gross profit increased by $100.8 million in fiscal 2012 compared to fiscal 2011 due to overall
revenue growth. Pharmacy gross profit was higher due to increased prescription volume and the
introduction of new generics including generic Lipitor, partially offset by continued pressure on
pharmacy benefit manager and governmental reimbursement rates. Front-end gross profit was driven by
higher sales reflecting the positive impact of our wellness + loyalty program and continued strong Rite
Aid Brand private label penetration.
We use the last-in, first-out (LIFO) method of inventory valuation, which is determined annually
when inflation rates and inventory levels are finalized. Therefore, LIFO costs for interim period
financial statements are estimated. The LIFO credit for fiscal 2013 was $147.9 million compared to a
LIFO charge of $188.7 million in fiscal 2012 and $44.9 million in fiscal 2011. The LIFO credit for fiscal
2013 was primarily the result of significant generic drug deflation partially offset by normal inflation on
brand drugs and front end products. During fiscal 2013, we experienced significant price decreases on
the recent high volume generic introductions. During the first few months after new generic drugs are
introduced, supplier prices tend to decrease as multiple suppliers enter the market place. The resulting
impact was an approximate 42% decline in our generic product price index this year compared to
approximately 6% last year. This significant generic deflation was partially offset by our branded
product inflation of approximately 12%, resulting in a net deflation rate of approximately 9% in our
overall pharmacy product mix in fiscal 2013, resulting in the LIFO credit noted above.
During fiscal 2012, we experienced significant brand price inflation of approximately 12%. Brand
pharmacy prices increased by approximately 2% more than in fiscal 2011. We did not yet experience
the significant generic deflation impact described above. As a result, inflation on our overall pharmacy
product mix was 5% and we incurred the significant LIFO charge noted above. The charge in fiscal
2012 was higher than fiscal 2011 due to the 2% higher branded product inflation rates.
Selling, General and Administrative Expenses
SG&A expenses increased by $69.4 million in fiscal 2013 compared to fiscal 2012 due primarily to
the reversal of $91.3 million of tax indemnification asset resulting from our settlement with the IRS
and certain states associated with pre-acquisition Brooks Eckerd tax issues, which are offset by an
income tax benefit as noted below (in ‘‘Income Taxes’’), litigation charges relating to the settlement of
certain labor related actions and increased associate bonus expense. These amounts are partially offset
by lower operating costs associated with one less week this year, lower depreciation and amortization,
lower self insurance expense due primarily to the impact of the discount rate change on the prior year
expense and the favorable settlement related to payment card interchange fee litigation. SG&A
expenses as a percentage of revenue was 26.0% in fiscal 2013 compared to 25.0% in fiscal 2012. The
increase in SG&A as a percentage of revenues relative to the prior year is due in part to the continued
impact of recent generic introductions and reimbursement rate pressures which has resulted in a lower
revenue base to measure our SG&A expenses against.
SG&A expenses increased by $73.6 million in fiscal 2012 compared to fiscal 2011 due mostly to
expenses associated with the fifty-third week in fiscal 2012. SG&A as a percentage of revenue improved
over fiscal 2011 due to leveraging our fixed costs relative to revenue growth. SG&A for fiscal 2012 was
25.0% as a percentage of revenue, compared to 25.6% in fiscal 2011. The decrease in SG&A as a
percentage of revenues is mostly due to a decrease in salaries and benefits resulting from continued
labor control initiatives, lower occupancy and lower depreciation and amortization, and other cost
30