Rue 21 2010 Annual Report Download - page 43
Download and view the complete annual report
Please find page 43 of the 2010 Rue 21 annual report below. You can navigate through the pages in the report by either clicking on the pages listed below, or by using the keyword search tool below to find specific information within the annual report.-
 1
1 -
2
-
3
-
4
-
5
-
6
-
7
-
8
-
9
-
10
-
11
-
12
-
13
-
14
-
15
-
16
-
17
-
18
-
19
-
20
-
21
-
22
-
23
-
24
-
25
-
26
-
27
-
28
-
29
-
30
-
31
-
32
-
 33
33 -
 34
34 -
 35
35 -
 36
36 -
 37
37 -
 38
38 -
 39
39 -
 40
40 -
 41
41 -
 42
42 -
 43
43 -
 44
44 -
 45
45 -
 46
46 -
 47
47 -
 48
48 -
 49
49 -
 50
50 -
 51
51 -
 52
52 -
 53
53 -
54
-
55
-
56
-
57
-
58
-
59
-
60
-
61
-
62
-
63
-
64
-
65
-
66
-
67
-
68
-
69
-
70
-
71
-
72
-
73
-
74
-
75
-
76
-
77
-
78
-
79
-
80
-
81
-
82
-
83
-
84
 |
 |

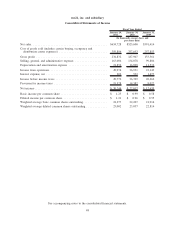
As of January 29, 2011, we had cash and cash equivalents totaling $50.1 million. Our cash and cash equivalents
consist of cash on deposit and credit and debit card transactions. Our cash and cash equivalents balance at
January 29, 2011 increased by $23.3 million from $26.8 million at January 31, 2010. Components of this change in
cash for fiscal year 2010, as well as for change in cash for the fiscal years 2009 and 2008, are provided below in
more detail.
A summary of operating, investing and financing activities are shown in the following table:
January 29,
2011
January 30,
2010
January 31,
2009
Fiscal Year Ended
(In thousands)
Provided by operating activities ...................... $61,643 $ 48,779 $ 36,859
Used for investing activities ......................... (40,480) (33,630) (26,464)
Provided by (used for) for financing activities ............ 2,197 6,991 (9,127)
Increase in cash and cash equivalents .................. $23,360 $ 22,140 $ 1,268
Operating Activities
Operating activities consist primarily of net income adjusted for non-cash items, including depreciation and
amortization, deferred taxes, the effect of working capital changes and tenant allowances received from landlords.
January 29,
2011
January 30,
2010
January 31,
2009
Fiscal Year Ended
(In thousands)
Net income ..................................... $30,244 $22,017 $ 12,639
Adjustments to reconcile net income to net cash provided by
operating activities:
Depreciation and amortization ........................ 21,852 16,994 11,624
Deferred taxes . . . ................................ 664 1,158 1,900
Share-based compensation .......................... 2,240 410 —
Merchandise inventory ............................. (23,358) (5,855) (19,685)
Accounts payable . ................................ 22,112 (486) 24,134
Other working capital components .................... 8,994 14,544 5,679
All other ....................................... (1,105) (3) 568
Net cash provided by operating activities ............... $61,643 $48,779 $ 36,859
During fiscal year 2010, we generated $61.6 million in cash from operating activities; as compared to
$48.8 million during fiscal year 2009 and $36.9 million in fiscal year 2008. Our major source of cash from
operations was attributable to an increase in net income of $8.2 million and an increase in accounts payable of
$22.1 million. Net cash was reduced for additional merchandise inventory required by operations of $23.4 million.
During fiscal year 2009, we generated $48.8 million in cash from operating activities; as compared to
$36.9 million in fiscal year 2008, an increase of $11.9 million. This increase in cash from operating activities was
primarily attributable to an increase in net income of $9.4 million, which includes the one-time termination fee of
$1.5 million paid to Apax, an increase in non-cash depreciation and amortization of $5.4 million, which reflects our
increased level of cumulative capital investments over the past several fiscal years and improvements in our
requirements for merchandise inventory of $13.8 million as compared to fiscal year 2008. In addition, other
working capital components increased by $8.9 million due to increases in accrued expenses and in tenant
allowances received from landlords as a result of new store openings. These cash inflows and improvements
were offset by reduction in the level of accounts payable, which decreased our cash from operating activities by
$24.6 million as compared to fiscal year 2008.
39