Tesco 1998 Annual Report Download - page 6
Download and view the complete annual report
Please find page 6 of the 1998 Tesco annual report below. You can navigate through the pages in the report by either clicking on the pages listed below, or by using the keyword search tool below to find specific information within the annual report.-
 1
1 -
 2
2 -
 3
3 -
 4
4 -
 5
5 -
 6
6 -
 7
7 -
 8
8 -
 9
9 -
 10
10 -
 11
11 -
 12
12 -
 13
13 -
 14
14 -
 15
15 -
 16
16 -
 17
17 -
18
-
19
-
20
-
21
-
22
-
23
-
24
-
25
-
26
-
27
-
28
-
29
-
30
-
31
-
32
-
33
-
34
-
35
-
36
-
37
-
38
-
39
-
40
-
41
-
42
-
43
-
44
-
45
 |
 |

Operating and financial review
4
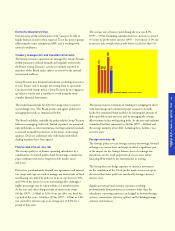
Change in net debt
Total net debt at the year end amounted to £1,191m
(1997 – £749m). This reflects the cash outflow from our net
capital expenditure and acquisitions of £1,339m (1997 – £726m),
partly offset by the proceeds from the disposal of Catteau S.A.,
together with strong cash generation from the main business of
£1,156m (1997 – £1,219m). As a result, gearing at the year end
has increased to 31% (February 1997 – 19%).
Total shareholder return, which is measured as the percentage
change in the share price plus the dividend, has been 170% over
the last five years, compared to the market average of 134% and
has been 131% over the last three years, compared to the market
average of 103%. In the last year, total shareholder return in
Tesco has been 58% compared to the market average of 31%.
This reflects our efforts to grow the business while ensuring
returns to shareholders are improved.
c o n t i n u e d
Shareholder returns and dividends
Adjusted fully diluted earnings per share (excluding the net loss
on disposal of fixed assets and discontinued operations and
integration costs) increased by 13.2% to 26.6p (1997 – 23.5p).
This is on a 53 week basis compared to 52 weeks last year.
On a comparable basis, fully diluted earnings per share would
be up 11.1% to 26.1p.
The Board has proposed a final net dividend of 8.05p giving
a total dividend for the year of 11.60p (1997 – 10.35p).
The dividend is covered 2.3 times by earnings and represents an
increase of 12.1%.
Shareholders’ funds reduced by £14m to £3,876m (1997 –
£3,890m). This was due to goodwill write-off of £445m and
losses on foreign currency translation of £14m. These were offset
by retained profits of £250m, issue of new shares less expenses of
£60m and £135m from write-back of goodwill. As a result,
return on shareholders’ funds was 21.4%.
The share price rose from 349p at the start of the financial year
to 517p on 27 February 1998, giving a market capitalisation of
approximately £11.4bn (1997 – £7.6bn).The share price reached
a high of 539p on 30 January 1998.
Year 2000
Formal procedures have been put in place worldwide to identify
the full impact of the Year 2000 on the Group. A project group
has been established and a timetable has been agreed. Progress
against the timetable is monitored centrally and it allows for all
Tesco systems which have been identified as requiring an upgrade
to be made compliant well before the end of the century, to
minimise any potential exposure to the Year 2000 effect. We
anticipate that the incremental cost, including modifying existing
software, will be approximately £30m.
94 95 96 97 98 G roup net debt £ m
Te s c o
M a r ke t
Total shareholder returns %
M a r 9 7 M a y J u l y S e p t Nov J a n 9 8
Tesco share price p e n c e
500
400
300