Tesco 2006 Annual Report Download - page 3
Download and view the complete annual report
Please find page 3 of the 2006 Tesco annual report below. You can navigate through the pages in the report by either clicking on the pages listed below, or by using the keyword search tool below to find specific information within the annual report.-
 1
1 -
 2
2 -
 3
3 -
 4
4 -
 5
5 -
 6
6 -
 7
7 -
 8
8 -
 9
9 -
 10
10 -
 11
11 -
 12
12 -
 13
13 -
 14
14 -
15
-
16
-
17
-
18
-
19
-
20
-
21
-
22
-
23
-
24
-
25
-
26
-
27
-
28
-
29
-
30
-
31
-
32
-
33
-
34
-
35
-
36
-
37
-
38
-
39
-
40
-
41
-
42
-
43
-
44
-
45
-
46
-
47
-
48
-
49
-
50
-
51
-
52
-
53
-
54
-
55
-
56
-
57
-
58
-
59
-
60
-
61
-
62
-
63
-
64
-
65
-
66
-
67
-
68
-
69
-
70
-
71
-
72
-
73
-
74
-
75
-
76
-
77
-
78
-
79
-
80
-
81
-
82
-
83
-
84
-
85
-
86
-
87
-
88
-
89
-
90
-
91
-
92
-
93
-
94
-
95
-
96
-
97
-
98
-
99
-
100
-
101
-
102
-
103
-
104
-
105
-
106
-
107
-
108
-
109
-
110
-
111
-
112
-
113
-
114
-
115
-
116
 |
 |

1Tesco plc
3
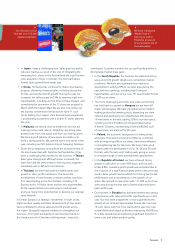
Over 2,500 products
feature our new
nutritional labelling
–by the end of this year
the entire range will
have been completed.
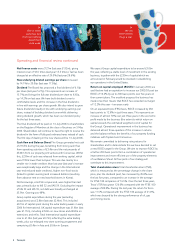
3
Our first two Finest
potato lines, Exquisa
and Smile, were
specifically selected
to offer customers
an enhanced taste.
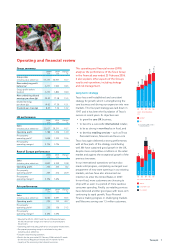
Operating and financial review
This operating and financial review (OFR)
analyses the performance of the Tesco Group
in the financial year ended 25 February 2006.
It also explains other aspects of the Group’s
results and operations, including strategy
and risk management.
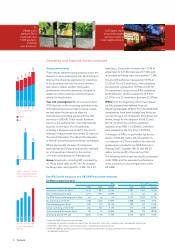
Long term strategy
Tesco has a well-established and consistent
strategy for growth, which is strengthening the
core business and driving our expansion into new
markets. This four-part strategy was laid down in
1997 and it has been the foundation of Tesco’s
success in recent years. Its objectives are:
• togrow the coreUK business,
• to become a successful international retailer,
• to be as strong in non-food as in food, and
• todevelop retailing services – such as Tesco
Personal Finance, Telecoms and tesco.com
Tesco has again delivered a strong performance,
with all four parts of the strategy contributing
well. We have sustained good growth in the UK,
despitemore competitive conditions in the retail
market and againstthe exceptional growth of the
previous two years.
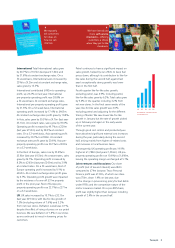
In our international operations wehave also
made solid progress, completing our largest ever
programme of new store openings in our existing
markets, and wehavealsoannounced our
intention to enter the United States in 2007.
In non-food, morecustomers are choosing to
shop with us even in a period of more cautious
consumer spending. Finally, our retailing services
havedelivered another good year, with tesco.com
continuing its rapid growth, Tesco Personal
Finance making progress in challenging markets
and Telecoms serving over 1.5 million customers.
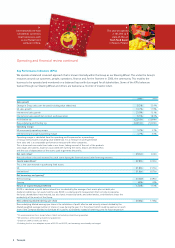
Group summary
2006#ø 2005#Change
£m £m %
Group sales
(including value added tax) 43,137 36,957 16.7
New underlying profit
before tax†2,277 1,925 18.3
Group profit before
taxation 2,235 1,894 18.0
New underlying diluted
earnings per share (p) 20.30 17.58 15.5
Diluted earnings
per share (p) 19.92 17.30 15.1
Dividend per share (p) 8.63 7.56 14.2
UK performance
2006ø2005 Change
£m £m %
Sales
(including value added tax) 32,657 29,511 10.7
Operating profit 1,788 1,556 14.9
Pre-property
operating profit* 1,698 1,535 10.6
Pre-property
operating margin‡5.7% 5.7%
Rest of Europe performance
2006ø2005 Change
£m £m %
Sales
(including value added tax) 5,820 4,349 33.8
Operating profit 263 243 8.2
Pre-property
operating profit* 269 212 26.9
Pre-property
operating margin‡5.3% 5.6%
Asia performance
2006#ø 2005#Change
£m £m %
Sales
(including value added tax) 4,660 3,097 50.5
Operating profit 229 153 49.7
Pre-property
operating profit* 236 156 51.3
Pre-property
operating margin‡5.4% 5.4%
†Adjusted for IAS 32, IAS 39 and the net difference between
the IAS 19 pension charge and ‘normal’ cash contributions
for pensions.
*Operating profit excluding profit or loss on property-related items.
‡Pre-property operating margin is calculated using sales
excluding value added tax.
#Excludes discontinuing operation.
øResults for the year ended 25 February 2006 include 52 weeks
for the UK and Republic of Ireland and 14 months for the
majority of the remaining International businesses.
02 03 0504
SALES PERFORMANCE
£m
28,280
25,401
23,101
33,55726,876
06
43,13732,657
41,81929,511
21,454
GROUP
UK
§ Including 60 weeks
International
§
02 0403
UK SALES GROWTH %
7.7
8.8
4.0
05
16.314.26.7
06
10.77.5
11.99.0
6.0
TOTAL
LIKE-FOR-LIKE
53rd WEEK