Vodafone 2010 Annual Report Download - page 15
Download and view the complete annual report
Please find page 15 of the 2010 Vodafone annual report below. You can navigate through the pages in the report by either clicking on the pages listed below, or by using the keyword search tool below to find specific information within the annual report.-
 1
1 -
2
-
3
-
4
-
 5
5 -
 6
6 -
 7
7 -
 8
8 -
 9
9 -
 10
10 -
 11
11 -
 12
12 -
 13
13 -
 14
14 -
 15
15 -
 16
16 -
 17
17 -
 18
18 -
 19
19 -
 20
20 -
 21
21 -
 22
22 -
 23
23 -
 24
24 -
 25
25 -
26
-
27
-
28
-
29
-
30
-
31
-
32
-
33
-
34
-
35
-
36
-
37
-
38
-
39
-
40
-
41
-
42
-
43
-
44
-
45
-
46
-
47
-
48
-
49
-
50
-
51
-
52
-
53
-
54
-
55
-
56
-
57
-
58
-
59
-
60
-
61
-
62
-
63
-
64
-
65
-
66
-
67
-
68
-
69
-
70
-
71
-
72
-
73
-
74
-
75
-
76
-
77
-
78
-
79
-
80
-
81
-
82
-
83
-
84
-
85
-
86
-
87
-
88
-
89
-
90
-
91
-
92
-
93
-
94
-
95
-
96
-
97
-
98
-
99
-
100
-
101
-
102
-
103
-
104
-
105
-
106
-
107
-
108
-
109
-
110
-
111
-
112
-
113
-
114
-
115
-
116
-
117
-
118
-
119
-
120
-
121
-
122
-
123
-
124
-
125
-
126
-
127
-
128
-
129
-
130
-
131
-
132
-
133
-
134
-
135
-
136
-
137
-
138
-
139
-
140
-
141
-
142
-
143
-
144
-
145
-
146
-
147
-
148
 |
 |

Vodafone Group Plc Annual Report 2010 13
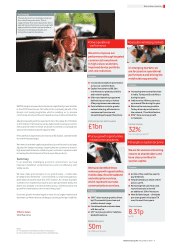
Distribution
Our customers interact with us in a variety of ways including via retail
locations, by telephone or increasingly online. Through our subsidiaries,
we directly own and manage approximately 2,100 stores selling
services to customers and providing customer support. To be most
accessible to our customers we constantly review our store footprint
and capabilities. We also have around 7,600 Vodafone branded stores
in our controlled markets which sell our products and services
exclusively through franchise and exclusive dealer arrangements.
Additionally, in most operating companies, sales forces are in place to
sell directly to business customers. The internet is increasingly a key
channel to promote and sell our products and services and to provide
customers with an easy, user friendly and accessible way to manage
their services and access support, whilst reducing costs for the Group.
The extent of indirect distribution varies between markets but may
include using third party service providers, independent dealers,
distributors and retailers. We host mobile virtual network operators
(‘MVNOs’) in a number of markets, selling access to our network at a
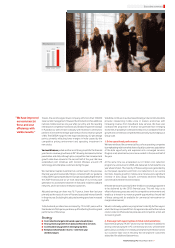
wholesale level. Historically we have measured customer
satisfaction using our customer delight
index, a proprietary diagnostic system
which tracks customer satisfaction across
all points of interaction with Vodafone and
identifies the drivers of customer delight
and their relative impact.
At the end of the 2010 financial year we
migrated to the net promoter score (‘NPS’)
customer measurement system to
monitor and drive customer satisfaction at
both an operational and country level in
many of our markets. The NPS diagnostic
system replaces the customer delight
index and uses a scale of how likely
customers would be to recommend
us to friends and family.
Customer satisfaction
Vodafone branded
franchise stores
7,600
(2009: 5,300; 2008: 5,800)
Customer delight index
73.1
(2009: 72.9; 2008: 73.1)
Business
Directly owned and
managed stores
2,100
(2009: 1,800; 2008: 1,150)