3M 2004 Annual Report Download - page 2
Download and view the complete annual report
Please find page 2 of the 2004 3M annual report below. You can navigate through the pages in the report by either clicking on the pages listed below, or by using the keyword search tool below to find specific information within the annual report.-
 1
1 -
 2
2 -
 3
3 -
 4
4 -
 5
5 -
 6
6 -
 7
7 -
 8
8 -
 9
9 -
 10
10 -
 11
11 -
 12
12 -
 13
13 -
14
-
15
-
16
-
17
-
18
-
19
-
20
-
21
-
22
-
23
-
24
-
25
-
26
-
27
-
28
-
29
-
30
-
31
-
32
-
33
-
34
-
35
-
36
-
37
-
38
-
39
-
40
-
41
-
42
-
43
-
44
-
45
-
46
-
47
-
48
-
49
-
50
-
51
-
52
-
53
-
54
-
55
-
56
-
57
-
58
-
59
-
60
-
61
-
62
-
63
-
64
-
65
-
66
-
67
-
68
-
69
-
70
-
71
-
72
-
73
-
74
-
75
-
76
-
77
-
78
-
79
-
80
-
81
-
82
-
83
-
84
-
85
-
86
-
87
-
88
-
89
-
90
-
91
-
92
-
93
-
94
-
95
-
96
-
97
-
98
-
99
-
100
-
101
-
102
-
103
-
104
-
105
-
106
 |
 |

A GLOBAL, DIVERSIFIED TECHNOLOGY COMPANY
For more than 100 years, we’ve been inventing and reinventing …
focusing and expanding … creating new technology platforms …
and developing innovative products for new and existing markets.
Our spirit of innovation and commitment to customers continue
to drive strong results.
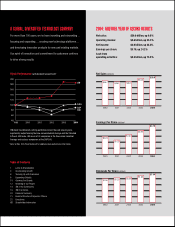
2004: ANOTHER YEAR OF RECORD RESULTS
Net sales: $20.0 billion, up 9.8%
Operating income: $4.6 billion, up 23.3%
Net income: $3.0 billion, up 24.4%
Earnings per share: $3.75, up 24.2%
Cash from
operating activities: $4.3 billion, up 13.5%
Stock Performance (with dividend reinvestment)*
40
60
80
100
120
140
160
180
200
1999 2000 2001 2002 2003 2004
S&P
500
DJIA
3M
3M stock has delivered a strong performance over the past several years,
significantly outperforming the Dow Jones Industrial Average and the Standard
& Poor’s 500 Index. 3M is one of 30 companies in the Dow Jones Industrial
Average and is also a component of the S&P 500.
* Refer to 3M’s 2005 Proxy Statement for additional stock performance information.
Table of Contents
1 Letter to Shareholders
4 Accelerating Growth
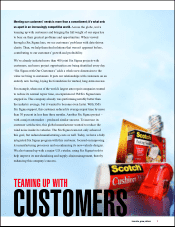
6 Teaming Up with Customers
8 Expanding Globally
10 Growing Our Brands
12 Investing in Our People
14 3M in the Community
16 3M At a Glance
20 Financial Summary
21 Board of Directors/Corporate Officers
22 Executives
IBC Shareholder Information
20042003200220012000
Net Sales (billions)
$16.7
$20.0
$18.2
$16.3
$16.1
20042003200220012000
Earnings Per Share (dollars)
$2.23
$3.75
$3.02
$2.50
$1.79
20042003200220012000
Dividends Per Share (dollars)
$1.16
$1.44
$1.32
$1.24
$1.20