3M 2013 Annual Report Download - page 74
Download and view the complete annual report
Please find page 74 of the 2013 3M annual report below. You can navigate through the pages in the report by either clicking on the pages listed below, or by using the keyword search tool below to find specific information within the annual report.-
 1
1 -
2
-
3
-
4
-
5
-
6
-
7
-
8
-
9
-
10
-
11
-
12
-
13
-
14
-
15
-
16
-
17
-
18
-
19
-
20
-
21
-
22
-
23
-
24
-
25
-
26
-
27
-
28
-
29
-
30
-
31
-
32
-
33
-
34
-
35
-
36
-
37
-
38
-
39
-
40
-
41
-
42
-
43
-
44
-
45
-
46
-
47
-
48
-
49
-
50
-
51
-
52
-
53
-
54
-
55
-
56
-
57
-
58
-
59
-
60
-
61
-
62
-
63
-
 64
64 -
 65
65 -
 66
66 -
 67
67 -
 68
68 -
 69
69 -
 70
70 -
 71
71 -
 72
72 -
 73
73 -
 74
74 -
 75
75 -
 76
76 -
 77
77 -
 78
78 -
 79
79 -
 80
80 -
 81
81 -
 82
82 -
 83
83 -
 84
84 -
85
-
86
-
87
-
88
-
89
-
90
-
91
-
92
-
93
-
94
-
95
-
96
-
97
-
98
-
99
-
100
-
101
-
102
-
103
-
104
-
105
-
106
-
107
-
108
-
109
-
110
-
111
-
112
-
113
-
114
-
115
-
116
-
117
-
118
-
119
-
120
-
121
-
122
-
123
-
124
-
125
-
126
-
127
-
128
-
129
-
130
-
131
-
132
 |
 |

68
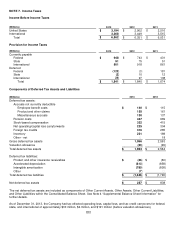
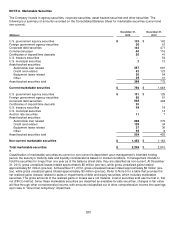
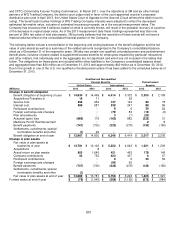
NOTE 7. Income Taxes
Income Before Income Taxes
(Millions)
2013
2012
2011
United States
$
3,194
$ 2,902
$ 2,516
International
3,368
3,449
3,515
Total
$
6,562
$ 6,351
$ 6,031
Provision for Income Taxes
(Millions)
2013
2012
2011
Currently payable
Federal
$
948
$ 743
$ 431
State
91
75
51
International
901
918
861
Deferred
Federal
(123)
(3)
181
State
(2)
10
12
International
26
97
138
Total
$
1,841
$ 1,840
$ 1,674
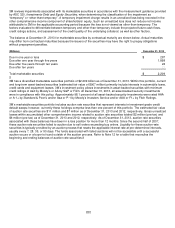
Components of Deferred Tax Assets and Liabilities
(Millions)
2013
2012
Deferred tax assets:
Accruals not currently deductible
Employee benefit costs $
140
$
115
Product and other claims 155
161
Miscellaneous accruals 130
137
Pension costs 447
969
Stock-based compensation 322
415
Net operating/capital loss carryforwards 225
304
Foreign tax credits 316
285
Inventory 221
189
Other - net ―
18
Gross deferred tax assets 1,956
2,593
Valuation allowance
(23)
(29)
Total deferred tax assets $
1,933
$
2,564
Deferred tax liabilities:
Product and other insurance receivables $
(46)
$
(60)
Accelerated depreciation
(813)
(858)
Intangible amortization
(780)
(808)
Other
(7)
―
Total deferred tax liabilities $
(1,646)
$
(1,726)
Net deferred tax assets $
287
$
838
The net deferred tax assets are included as components of Other Current Assets, Other Assets, Other Current Liabilities,
and Other Liabilities within the Consolidated Balance Sheet. See Note 4 “Supplemental Balance Sheet Information” for
further details.
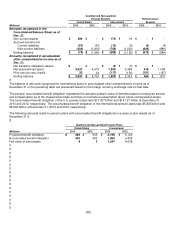
As of December 31, 2013, the Company had tax effected operating loss, capital loss, and tax credit carryovers for federal,
state, and international of approximately $30 million, $4 million, and $191 million (before valuation allowances),