AT&T Wireless 2009 Annual Report Download - page 56
Download and view the complete annual report
Please find page 56 of the 2009 AT&T Wireless annual report below. You can navigate through the pages in the report by either clicking on the pages listed below, or by using the keyword search tool below to find specific information within the annual report.-
 1
1 -
2
-
3
-
4
-
5
-
6
-
7
-
8
-
9
-
10
-
11
-
12
-
13
-
14
-
15
-
16
-
17
-
18
-
19
-
20
-
21
-
22
-
23
-
24
-
25
-
26
-
27
-
28
-
29
-
30
-
31
-
32
-
33
-
34
-
35
-
36
-
37
-
38
-
39
-
40
-
41
-
42
-
43
-
44
-
45
-
 46
46 -
 47
47 -
 48
48 -
 49
49 -
 50
50 -
 51
51 -
 52
52 -
 53
53 -
 54
54 -
 55
55 -
 56
56 -
 57
57 -
 58
58 -
 59
59 -
 60
60 -
 61
61 -
 62
62 -
 63
63 -
 64
64 -
 65
65 -
 66
66 -
67
-
68
-
69
-
70
-
71
-
72
-
73
-
74
-
75
-
76
-
77
-
78
-
79
-
80
-
81
-
82
-
83
-
84
-
85
-
86
-
87
-
88
-
89
-
90
-
91
-
92
-
93
-
94
-
95
-
96
-
97
-
98
-
99
-
100
 |
 |

Management’s Discussion and Analysis of Financial Condition and Results of Operations (continued)
Dollars in millions except per share amounts
54 AT&T 09 AR
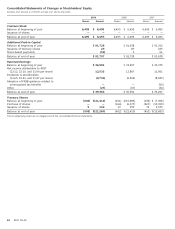
Issuer Equity Repurchases
On December 10, 2007, our Board of Directors authorized a share repurchase plan of 400 million shares that expired at
December 31, 2009. During 2009, we repurchased 133 thousand shares at a cost of $3. We anticipate concentrating on
reducing debt levels in 2010.
Total Number of Maximum Number
Shares Purchased as of Shares that May
Part of Publicly Yet Be Purchased
Total Number of Average Price Announced Plans Under the Plans
Purchase Period Shares Purchased Paid per Share1 or Programs or Programs
February 1, 2009 – February 28, 2009 133,334 $25.16 133,334 0
Total 133,334 $25.16 133,334 0
1Average Price Paid per Share excludes transaction costs.
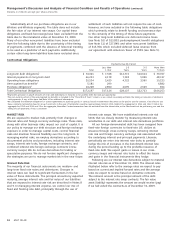
STO C K PER FORM A N C E G R A P H
Comparison of Five Year Cumulative Total Return
AT&T Inc., S&P 500 Index, and S&P 500 Integrated Telecom Index
200
190
180
170
160
150
140
130
120
110
100
90
80
70
12/04 12/05 12/06 12/07 12/08 12/09
100
105
143
169
140
135
133
185
95
121
102
81
128
154
100
S&P 500 Integrated
Telecom Index
AT&T Inc. S&P 500 Index
127
The comparison above assumes $100 invested on December 31, 2004, in AT&T common stock, Standard & Poor’s 500 Index
(S&P 500), and Standard & Poor’s 500 Integrated Telecom Index (Telecom Index). Total return equals stock price appreciation
plus reinvestment of dividends.