Apple 1996 Annual Report Download - page 14
Download and view the complete annual report
Please find page 14 of the 1996 Apple annual report below. You can navigate through the pages in the report by either clicking on the pages listed below, or by using the keyword search tool below to find specific information within the annual report.Item 7. Management's Discussion and Analysis of Financial Condition and Results of Operations
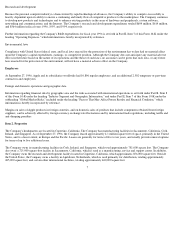
The following discussion should be read in conjunction with the consolidated financial statements and notes thereto. All information is based
on the Company's fiscal calendar.
(Tabular information: Dollars in millions, except per share amounts)
NM: Not Meaningful
Overview
During the last nine months of 1996, the Company experienced a significant decline in net sales, units shipped, and share of the personal
computer market. This decline in demand and the resulting losses, coupled with intense price competition throughout the industry, led to the
Company's decision to implement a new strategic direction intended to improve the Company's competitiveness and restore its profitability.
The Company has initiated programs to develop and market products and services more selectively targeted to education, home, and business
segments. In moving in this new strategic direction, the Company expects to reduce the number of new product introductions and the number
of products in certain categories within its current product portfolio.
Net Sales
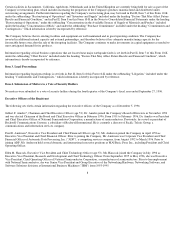
Net sales trended downward beginning in the second quarter of 1996, decreasing $1,229 million, or 11%; $1,545 million, or 19%; and $682
million, or 23%; during the twelve, nine, and three months ended September 27, 1996, respectively, compared with the same periods in 1995,
due to a decrease in net sales of Macintosh(registered trademark) computers and of peripheral products such as displays and printers. Total
Macintosh computer unit sales trended downward beginning in the second quarter of 1996, decreasing 11%, 19%, and 26% during the twelve,
nine, and three months ended September 27, 1996, respectively, compared with the same periods in 1995. This decline in unit sales was a result
of a decline or lack of growth in worldwide demand for all product families, which the Company believes was due principally to customer
concerns regarding the Company's strategic direction, financial condition, and future prospects, and due to delays in the shipment of certain
PowerBook(registered trademark) products as a result of quality problems. In addition, unit sales of peripheral products trended downward
beginning in the second quarter of 1996, decreasing 20%, 24%, and 30% during the twelve, nine and three months ended September 27, 1996,
respectively, compared with the same periods in 1995, for the reasons noted above. The average aggregate revenue per Macintosh unit
increased slightly during the twelve and three months ended September 27, 1996, and decreased slightly during the nine months ended
September 27, 1996, compared with the same periods in 1995, primarily due to a continued shift in product mix toward the Company's newer
products and products with multimedia configurations, offset to varying degrees by pricing actions across all product lines in order to
12
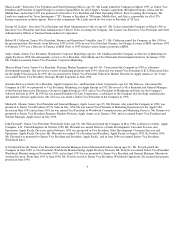
Results of
Operations 1996 Change 1995 Change 1994
Net sales $9,833 (11%) $11,062 20% $9,189
Gross margin $ 968 (66%) $ 2,858 22% $2,343
Percentage of
net sales 9.8% 25.8% 25.5%
Research and
development $ 604 (2%) $ 614 9% $ 564
Percentage of
net sales 6.1% 5.6% 6.1%
Selling, general and
administrative $1,568 (1%) $ 1,583 14% $1,384
Percentage of
net sales 15.9% 14.3% 15.1%
Restructuring
costs $ 179 NM $ (23) NM $ (127)
Percentage of
net sales 1.8% (0.2%) (1.4%)
Interest and other
income(expense),
net $ 88 NM $ (10) 55% $ (22)
Net income
(loss) $ (816)(292%) $ 424 37% $ 310
Earnings (loss)
per share $(6.59)(291%) $ 3.45 32% $ 2.61


