BP 2006 Annual Report Download - page 21
Download and view the complete annual report
Please find page 21 of the 2006 BP annual report below. You can navigate through the pages in the report by either clicking on the pages listed below, or by using the keyword search tool below to find specific information within the annual report.-
 1
1 -
2
-
3
-
4
-
5
-
6
-
7
-
8
-
9
-
10
-
 11
11 -
 12
12 -
 13
13 -
 14
14 -
 15
15 -
 16
16 -
 17
17 -
 18
18 -
 19
19 -
 20
20 -
 21
21 -
 22
22 -
 23
23 -
 24
24 -
 25
25 -
 26
26 -
 27
27 -
 28
28 -
 29
29 -
 30
30 -
 31
31 -
32
-
33
-
34
-
35
-
36
-
37
-
38
-
39
-
40
-
41
-
42
-
43
-
44
-
45
-
46
-
47
-
48
-
49
-
50
-
51
-
52
-
53
-
54
-
55
-
56
-
57
-
58
-
59
-
60
-
61
-
62
-
63
-
64
-
65
-
66
-
67
-
68
-
69
-
70
-
71
-
72
-
73
-
74
-
75
-
76
-
77
-
78
-
79
-
80
-
81
-
82
-
83
-
84
-
85
-
86
-
87
-
88
-
89
-
90
-
91
-
92
-
93
-
94
-
95
-
96
-
97
-
98
-
99
-
100
-
101
-
102
-
103
-
104
-
105
-
106
-
107
-
108
-
109
-
110
-
111
-
112
-
113
-
114
-
115
-
116
-
117
-
118
-
119
-
120
-
121
-
122
-
123
-
124
-
125
-
126
-
127
-
128
-
129
-
130
-
131
-
132
-
133
-
134
-
135
-
136
-
137
-
138
-
139
-
140
-
141
-
142
-
143
-
144
-
145
-
146
-
147
-
148
-
149
-
150
-
151
-
152
-
153
-
154
-
155
-
156
-
157
-
158
-
159
-
160
-
161
-
162
-
163
-
164
-
165
-
166
-
167
-
168
-
169
-
170
-
171
-
172
-
173
-
174
-
175
-
176
-
177
-
178
-
179
-
180
-
181
-
182
-
183
-
184
-
185
-
186
-
187
-
188
-
189
-
190
-
191
-
192
-
193
-
194
-
195
-
196
-
197
-
198
-
199
-
200
-
201
-
202
-
203
-
204
-
205
-
206
-
207
-
208
-
209
-
210
-
211
-
212
-
213
-
214
-
215
-
216
-
217
-
218
-
219
-
220
-
221
-
222
-
223
-
224
-
225
-
226
-
227
-
228
 |
 |

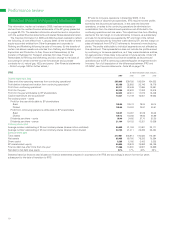
The following tables show BP’s estimated net proved reserves as at 31 December 2006.
Estimated net proved reserves of liquids at 31 December 2006ab million barrels
------------------------------------------------------------------------------------------------------------------------------------------------------------------------------------------------------------------------------------------------------------------------------------------------------------
Developed Undeveloped Total
------------------------------------------------------------------------------------------------------------------------------------------------------------------------------------------------------------------------------------------------------------------------------------------------------------
UK 458 146 604
Rest of Europe 189 97 286
USA 1,916 1,292 3,208
Rest of Americas 130 237 367c
Asia Pacific 67 86 153
Africa 193 512 705
Russia –––
Other 88 482 570
------------------------------------------------------------------------------------------------------------------------------------------------------------------------------------------------------------------------------------------------------------------------------------------------------------
Group 3,041 2,852 5,893
------------------------------------------------------------------------------------------------------------------------------------------------------------------------------------------------------------------------------------------------------------------------------------------------------------
Equity-accounted entities 3,888d
Estimated net proved reserves of natural gas at 31 December 2006ab billion cubic feet
------------------------------------------------------------------------------------------------------------------------------------------------------------------------------------------------------------------------------------------------------------------------------------------------------------
Developed Undeveloped Total
------------------------------------------------------------------------------------------------------------------------------------------------------------------------------------------------------------------------------------------------------------------------------------------------------------
UK 1,968 825 2,793
Rest of Europe 242 56 298
USA 10,438 4,660 15,098
Rest of Americas 3,932 9,194 13,126e
Asia Pacific 1,359 5,202 6,561
Africa 1,032 1,675 2,707
Russia –––
Other 331 1,254 1,585
------------------------------------------------------------------------------------------------------------------------------------------------------------------------------------------------------------------------------------------------------------------------------------------------------------
Group 19,302 22,866 42,168
------------------------------------------------------------------------------------------------------------------------------------------------------------------------------------------------------------------------------------------------------------------------------------------------------------
Equity-accounted entities 3,763f
Net proved reserves on an oil equivalent basis (mmboe)
–Group 13,163
– Equity-accounted entities 4,537
aNet proved reserves of crude oil and natural gas, stated as at 31 December 2006, exclude production royalties due to others, whether payable in cash or in kind, and include
minority interests in consolidated operations. We disclose our share of reserves held in joint ventures and associates that are accounted for by the equity method although
we do not control these entities or the assets held by such entities.
bIn certain deepwater fields, such as fields in the Gulf of Mexico, BP has claimed proved reserves before production flow tests are conducted, in part because of the
significant safety, cost and environmental implications of conducting these tests. The industry has made substantial technological improvements in understanding, measuring
and delineating reservoir properties without the need for flow tests. The general method of reserves assessment to determine reasonable certainty of commercial recovery
that BP employs relies on the integration of three types of data: (1) well data used to assess the local characteristics and conditions of reservoirs and fluids; (2) field scale
seismic data to allow the interpolation and extrapolation of these characteristics outside the immediate area of the local well control; and (3) data from relevant analogous
fields. Well data includes appraisal wells or sidetrack holes, full logging suites, core data and fluid samples. BP considers the integration of this data in certain cases to be
superior to a flow test in providing a better understanding of the overall reservoir performance. The collection of data from logs, cores, wireline formation testers, pressures
and fluid samples calibrated to each other and to the seismic data can allow reservoir properties to be determined over a greater volume than the localized volume of
investigation associated with a short term flow test. Historically, proved reserves recorded using these methods have been validated by actual production levels. As at the
end of 2006, BP had proved reserves in 22 fields in the deepwater Gulf of Mexico that had been initially booked prior to production flow testing. Of these fields, 18 have
been in production and two, Atlantis and Thunder Horse, are expected to begin production by the end of 2007 and by the end of 2008 respectively. Two other fields are in the
early stages of development.
cIncludes 23 million barrels of crude oil in respect of the 30% minority interest in BP Trinidad and Tobago LLC.
dIncludes 179 million barrels of crude oil in respect of the 6.29% minority interest in TNK-BP.
eIncludes 3,537 billion cubic feet of natural gas in respect of the 30% minority interest in BP Trinidad and Tobago LLC.
fIncludes 99 billion cubic feet of natural gas in respect of the 7.77% minority interest in TNK-BP.
BP Annual Report and Accounts 2006 19