BP 2006 Annual Report Download - page 22
Download and view the complete annual report
Please find page 22 of the 2006 BP annual report below. You can navigate through the pages in the report by either clicking on the pages listed below, or by using the keyword search tool below to find specific information within the annual report.-
 1
1 -
2
-
3
-
4
-
5
-
6
-
7
-
8
-
9
-
10
-
11
-
 12
12 -
 13
13 -
 14
14 -
 15
15 -
 16
16 -
 17
17 -
 18
18 -
 19
19 -
 20
20 -
 21
21 -
 22
22 -
 23
23 -
 24
24 -
 25
25 -
 26
26 -
 27
27 -
 28
28 -
 29
29 -
 30
30 -
 31
31 -
 32
32 -
33
-
34
-
35
-
36
-
37
-
38
-
39
-
40
-
41
-
42
-
43
-
44
-
45
-
46
-
47
-
48
-
49
-
50
-
51
-
52
-
53
-
54
-
55
-
56
-
57
-
58
-
59
-
60
-
61
-
62
-
63
-
64
-
65
-
66
-
67
-
68
-
69
-
70
-
71
-
72
-
73
-
74
-
75
-
76
-
77
-
78
-
79
-
80
-
81
-
82
-
83
-
84
-
85
-
86
-
87
-
88
-
89
-
90
-
91
-
92
-
93
-
94
-
95
-
96
-
97
-
98
-
99
-
100
-
101
-
102
-
103
-
104
-
105
-
106
-
107
-
108
-
109
-
110
-
111
-
112
-
113
-
114
-
115
-
116
-
117
-
118
-
119
-
120
-
121
-
122
-
123
-
124
-
125
-
126
-
127
-
128
-
129
-
130
-
131
-
132
-
133
-
134
-
135
-
136
-
137
-
138
-
139
-
140
-
141
-
142
-
143
-
144
-
145
-
146
-
147
-
148
-
149
-
150
-
151
-
152
-
153
-
154
-
155
-
156
-
157
-
158
-
159
-
160
-
161
-
162
-
163
-
164
-
165
-
166
-
167
-
168
-
169
-
170
-
171
-
172
-
173
-
174
-
175
-
176
-
177
-
178
-
179
-
180
-
181
-
182
-
183
-
184
-
185
-
186
-
187
-
188
-
189
-
190
-
191
-
192
-
193
-
194
-
195
-
196
-
197
-
198
-
199
-
200
-
201
-
202
-
203
-
204
-
205
-
206
-
207
-
208
-
209
-
210
-
211
-
212
-
213
-
214
-
215
-
216
-
217
-
218
-
219
-
220
-
221
-
222
-
223
-
224
-
225
-
226
-
227
-
228
 |
 |

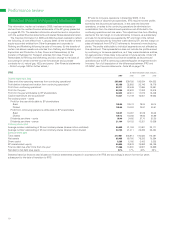
The following tables show BP’s production by major field for 2006, 2005 and 2004.
Liquids % thousand barrels per day
------------------------------------------------------------------------------------------------------------------------------------------------------------------------------------------------------------------------------------------------------------------------------------------------------------
BP net share of productiona
------------------------------------------------------------------------------------------------------------------------------------------------------------------------------------------------------------------------------------------------------------------------------------------------------------
Production Field or Area Interest 2006 2005 2004
------------------------------------------------------------------------------------------------------------------------------------------------------------------------------------------------------------------------------------------------------------------------------------------------------------
Alaska Prudhoe Bayb26.4 71 89 97
Kuparuk 39.2 57 62 68
Northstarb98.6 38 46 49
Milne Pointb100.0 31 37 44
Other Various 27 34 37
------------------------------------------------------------------------------------------------------------------------------------------------------------------------------------------------------------------------------------------------------------------------------------------------------------
Total Alaska 224 268 295
------------------------------------------------------------------------------------------------------------------------------------------------------------------------------------------------------------------------------------------------------------------------------------------------------------
Lower 48 onshorecVarious Various 125 130 142
------------------------------------------------------------------------------------------------------------------------------------------------------------------------------------------------------------------------------------------------------------------------------------------------------------
Gulf of Mexico deepwatercNa Kikab50.0 41 44 27
Horn Mountainb66.6 23 26 41
Kingb100.0 28 24 26
Mars 28.5 19 21 35
Ursa 22.7 21 19 29
Other Various 63 64 47
Gulf of Mexico ShelfcOther Various 316 24
------------------------------------------------------------------------------------------------------------------------------------------------------------------------------------------------------------------------------------------------------------------------------------------------------------
Total Gulf of Mexico 198 214 229
------------------------------------------------------------------------------------------------------------------------------------------------------------------------------------------------------------------------------------------------------------------------------------------------------------
Total USA 547 612 666
UK offshorecETAPdVarious 49 49 55
FoinavenbVarious 37 39 48
Magnusb85.0 30 30 34
Schiehallion/LoyalbVarious 26 28 39
Hardingb70.0 17 22 27
Andrewb62.8 712 12
Other Various 69 75 89
------------------------------------------------------------------------------------------------------------------------------------------------------------------------------------------------------------------------------------------------------------------------------------------------------------
Total UK offshore 235 255 304
------------------------------------------------------------------------------------------------------------------------------------------------------------------------------------------------------------------------------------------------------------------------------------------------------------
Onshore Wytch Farmb67.8 18 22 26
------------------------------------------------------------------------------------------------------------------------------------------------------------------------------------------------------------------------------------------------------------------------------------------------------------
Total UK 253 277 330
Netherlands Various Various 111
Norway Valhallb28.1 21 25 25
Draugen 18.4 15 20 27
Ulab80.0 14 17 16
Other Various 10 12 8
------------------------------------------------------------------------------------------------------------------------------------------------------------------------------------------------------------------------------------------------------------------------------------------------------------
Total Rest of Europe 61 75 77
Angola Kizomba A 26.7 54 56 16
Girassol 16.7 17 34 31
Xikomba 26.7 410 18
Other Various 58 28 6
Australia Various 15.8 34 36 36
Azerbaijan Azeri-Chirag-Gunashlib34.1 145 76 39
CanadacVarious Various 810 11
Colombia VariousbVarious 34 41 48
Egypt Various Various 42 47 57
Trinidad & TobagocVariousb100.0 40 40 59
VenezuelacVarious Various 26 55 55
OthercVarious Various 28 26 31
------------------------------------------------------------------------------------------------------------------------------------------------------------------------------------------------------------------------------------------------------------------------------------------------------------
Total Rest of World 490 459 407
Total groupe1,351 1,423 1,480
Equity-accounted entities (BP share)
Abu DhabifVarious Various 163 148 142
Argentina – Pan American Energy Various Various 69 67 64
Russia – TNK-BPcVarious Various 876 911 831
OthercVarious Various 16 13 14
------------------------------------------------------------------------------------------------------------------------------------------------------------------------------------------------------------------------------------------------------------------------------------------------------------
Total equity-accounted entities 1,124 1,139 1,051
aNet of royalty, whether payable in cash or in kind.
bBP-operated.
cIn 2006, BP divested its producing properties on the Outer Continental Shelf of the Gulf of Mexico and its interest in the Statfjord oil and gas field in the UK. Our interests in
the Boqueron, Desarollo Zulia Occidental (DZO) and Jusepin projects in Venezuela were reduced following a decision by the Venezuelan government. TNK-BP disposed of its
non-core interests in the Urdmurtneft assets. In 2005, BP divested the Teak, Samaan and Poui assets in Trinidad and sold interests in certain properties in the Gulf of Mexico.
In addition, BP exchanged the Gulf of Mexico deepwater Blind Faith prospect for Kerr McGee’s interest in the Arkoma Red Oak and Williburton fields. TNK-BP disposed of
non-core producing assets in the Saratov region. In 2004, BP agreed with AAR to incorporate their 50% interest in Slavneft into TNK-BP, an equity-accounted entity. BP also
acquired minor additional working interests in Canada and the US. BP diluted its working interests in King’s Peak and divested the Swordfish assets in the deepwater Gulf
of Mexico. Additionally, BP sold various properties including its interest in the South Pass 60 in the Gulf of Mexico Shelf, various assets in Alberta, Canada and the Kangean
PSA in Indonesia.
dVolumes relate to six BP-operated fields within ETAP. BP has no interests in the remaining three ETAP fields which are operated by Shell.
eIncludes 55 thousand net barrels of oil equivalent per day (mboe/d) of NGLs from processing plants in which BP has an interest (2005 58mboe/d and 2004 67mboe/d).
fThe BP group holds proportionate interests, through associates, in onshore and offshore concessions in Abu Dhabi expiring in 2014 and 2018, respectively.
20
------------------------------------------------------------------------------------------------------------------------------------------------------------------------------------------------------------------------------------------------------------------------------------