BP 2011 Annual Report Download - page 21
Download and view the complete annual report
Please find page 21 of the 2011 BP annual report below. You can navigate through the pages in the report by either clicking on the pages listed below, or by using the keyword search tool below to find specific information within the annual report.-
 1
1 -
2
-
3
-
4
-
5
-
6
-
7
-
8
-
9
-
10
-
 11
11 -
 12
12 -
 13
13 -
 14
14 -
 15
15 -
 16
16 -
 17
17 -
 18
18 -
 19
19 -
 20
20 -
 21
21 -
 22
22 -
 23
23 -
 24
24 -
 25
25 -
 26
26 -
 27
27 -
 28
28 -
 29
29 -
 30
30 -
 31
31 -
32
-
33
-
34
-
35
-
36
-
37
-
38
-
39
-
40
-
41
-
42
-
43
-
44
-
45
-
46
-
47
-
48
-
49
-
50
-
51
-
52
-
53
-
54
-
55
-
56
-
57
-
58
-
59
-
60
-
61
-
62
-
63
-
64
-
65
-
66
-
67
-
68
-
69
-
70
-
71
-
72
-
73
-
74
-
75
-
76
-
77
-
78
-
79
-
80
-
81
-
82
-
83
-
84
-
85
-
86
-
87
-
88
-
89
-
90
-
91
-
92
-
93
-
94
-
95
-
96
-
97
-
98
-
99
-
100
-
101
-
102
-
103
-
104
-
105
-
106
-
107
-
108
-
109
-
110
-
111
-
112
-
113
-
114
-
115
-
116
-
117
-
118
-
119
-
120
-
121
-
122
-
123
-
124
-
125
-
126
-
127
-
128
-
129
-
130
-
131
-
132
-
133
-
134
-
135
-
136
-
137
-
138
-
139
-
140
-
141
-
142
-
143
-
144
-
145
-
146
-
147
-
148
-
149
-
150
-
151
-
152
-
153
-
154
-
155
-
156
-
157
-
158
-
159
-
160
-
161
-
162
-
163
-
164
-
165
-
166
-
167
-
168
-
169
-
170
-
171
-
172
-
173
-
174
-
175
-
176
-
177
-
178
-
179
-
180
-
181
-
182
-
183
-
184
-
185
-
186
-
187
-
188
-
189
-
190
-
191
-
192
-
193
-
194
-
195
-
196
-
197
-
198
-
199
-
200
-
201
-
202
-
203
-
204
-
205
-
206
-
207
-
208
-
209
-
210
-
211
-
212
-
213
-
214
-
215
-
216
-
217
-
218
-
219
-
220
-
221
-
222
-
223
-
224
-
225
-
226
-
227
-
228
-
229
-
230
-
231
-
232
-
233
-
234
-
235
-
236
-
237
-
238
-
239
-
240
-
241
-
242
-
243
-
244
-
245
-
246
-
247
-
248
-
249
-
250
-
251
-
252
-
253
-
254
-
255
-
256
-
257
-
258
-
259
-
260
-
261
-
262
-
263
-
264
-
265
-
266
-
267
-
268
-
269
-
270
-
271
-
272
-
273
-
274
-
275
-
276
-
277
-
278
-
279
-
280
-
281
-
282
-
283
-
284
-
285
-
286
-
287
-
288
-
289
-
290
-
291
-
292
-
293
-
294
-
295
-
296
-
297
-
298
-
299
-
300
 |
 |

Business review: Group overview
BP Annual Report and Form 20-F 2011 19
Crude oil prices
Crude oil prices, as demonstrated by the industry benchmark of dated Brent for
the year, averaged $111.26 per barrel in 2011, about 40% above 2010’s average
of $79.50 per barrel. This represents the highest annual average ever (in nominal
terms), as well as the largest one-year increase ever.
Prices rose early in 2011 and then increased further following the loss of
Libyan supplies, which drove prices briefly above $125 per barrel in April. Thereafter,
weakening global economic growth, increased production by other OPEC producers
and the release of International Energy Agency (IEA) strategic stocks helped to
cushion the disruption. While oil prices eased over the remainder of the year, they
still ended the year above $100 per barrel.
These record prices prevailed despite the fact that the growth in global oil
consumption slowed in 2011 with demand rising by roughly 0.7 million barrels per
day for the year (0.8%)a in the face of slower economic growth and higher prices.
Growth in 2011 was concentrated in non-OECD countries, led by China. There was
relatively little change in non-OPEC production and, with the loss of Libyan supplies
beginning in February, OPEC crude oil production did not return to its January peak
until November. As a result, by mid-year OECD commercial oil inventories were
consistently below average for the first time since 2008.
By comparison, global oil consumption in 2010 grew by roughly 2.7 million
barrels per day (3.1%)b, the strongest growth in annual consumption since 2004,
driven by a renewed global economy. Crude oil prices in 2010 remained stable in a
range of $70-80 per barrel before beginning to increase in the fourth quarter due to
rising consumption and continuing OPEC production.
We expect oil price movements in 2012 to continue to be driven by the pace
of global economic growth and its resulting implications for oil consumption, and by
OPEC production decisions, especially in reaction to the recovery of Libyan supplies
and the EU embargo on Iranian crude.
Source: Platts/BP.
* See Refining and Marketing on page 94 for
further information on RMM.
35
70
2007 2008 2009 2010 2011
105
140
175
210
Crude oil and gas prices,
and refining margins
($ per barrel of oil equivalent)
Dated Brent oil price
Henry Hub gas price
(First of Month Index)
Average refining marker
margin (RMM)*
a From Oil Market Report February 2012
©, OECD/IEA 2012, page 5.
b BP Statistical Review of World Energy June 2011.
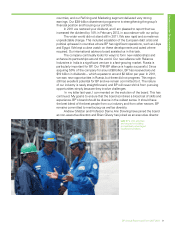
Below Work at BP’s
Castellón refinery,
Spain. Refining
margins in Europe
increased in 2011,
as demand for
commercial transport
improved.