Best Buy 2006 Annual Report Download - page 5
Download and view the complete annual report
Please find page 5 of the 2006 Best Buy annual report below. You can navigate through the pages in the report by either clicking on the pages listed below, or by using the keyword search tool below to find specific information within the annual report.-
 1
1 -
 2
2 -
 3
3 -
 4
4 -
 5
5 -
 6
6 -
 7
7 -
 8
8 -
 9
9 -
 10
10 -
 11
11 -
 12
12 -
 13
13 -
 14
14 -
 15
15 -
 16
16 -
17
-
18
-
19
-
20
-
21
-
22
-
23
-
24
-
25
-
26
-
27
-
28
-
29
-
30
-
31
-
32
-
33
-
34
-
35
-
36
-
37
-
38
-
39
-
40
-
41
-
42
-
43
-
44
-
45
-
46
-
47
-
48
-
49
-
50
-
51
-
52
-
53
-
54
-
55
-
56
-
57
-
58
-
59
-
60
-
61
-
62
-
63
-
64
-
65
-
66
-
67
-
68
-
69
-
70
-
71
-
72
-
73
-
74
-
75
-
76
-
77
-
78
-
79
-
80
-
81
-
82
-
83
-
84
-
85
-
86
-
87
-
88
-
89
-
90
-
91
-
92
-
93
-
94
-
95
-
96
-
97
-
98
-
99
-
100
-
101
-
102
-
103
-
104
-
105
-
106
-
107
-
108
-
109
-
110
-
111
-
112
-
113
-
114
-
115
-
116
-
117
-
118
 |
 |

Best Buy 2006 Annual Report 3
3
How did we accelerate customer centricity last year?In true Best Buy fashion, we
decided to explore the limits of our capacity for change. For example, we converted
a record number of stores to the customer-centric operating model. We finished the
year with 300 stores, or 40 percent of U.S. Best Buy stores, operating under this
model. We expanded the number of Geek Squad agents by 5,000, and brought our
home theater installation services in-house to provide a better and more consistent
experience for our customers. We grew memberships in Reward Zone, our customer
loyalty program, to 7.2 million, and learned more about customer purchase patterns.
In addition, because customer centricity relies on employees engaging with customers
in new ways, we also focused on increasing employee retention. We changed how
we manage our people. We made more extensive use of strengths-based tools and
did a better job of listening to our employees. We also created an incentive system in
which all store employees could share. This work yielded results as well— employee
retention improved by 15 percent.
To support our strategy, we have embarked on a four-year program to transform our
supply chain and information technology systems. Our transformation goal is a simple
infrastructure that is built on “vanilla” applications and processes tried and tested
from the food industry. To date, the results are both material and promising: our
customer-facing POS systems are faster, cost less and have the flexibility to adjust as
we transform our multi-channel experience for customers.
Naturally, along with the benefits of our transformation came new challenges. For
example, our current product-centric organization could not effectively support the new
business model. In the interest of speed, we created parallel groups to support customer
centricity in store management, finance, training, legal and marketing. Supporting
two operating models was costly; yet our plan was to focus on efficiency after we had
implemented customer centricity in all markets. We believed that speed to market was
more important.
Testing Our Capacity Limits
In retrospect, we moved too quickly in some areas. In the fiscal third quarter, the volume
of changes peaked, leading to a dispersion of results. Specifically, the performance
of customer centricity stores converted in our fiscal third quarter was modestly below
our expectations. We stopped conversions for 90 days, and our analysis indicated
that we had overestimated our capacity for change. We had asked stores to implement
customer centricity, hire more services personnel, introduce Image Labs, reset their enter-
tainment software space and implement a new approach to appliance sales. Most
stores had executed well on one or more of these dimensions. Yet no store was able
to demonstrate the same level of success with all of these dimensions. These results
indicated to me that the overall strategy was intact, but we simply had asked too much
of our people within the third quarter.
In the fourth quarter, we slowed the pace of changes, and we focused on simple
outcomes. In addition, stores that had received only the cultural aspects of customer
centricity made major strides. Soon rising consumer confidence and expense cutting
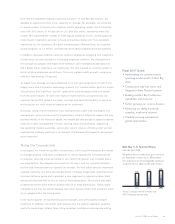
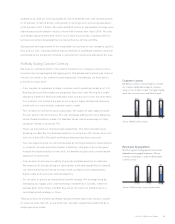
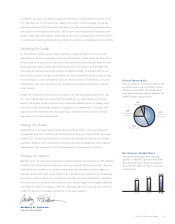
200520042003
18%
17%
15%
Source: Company internal estimates and
NPD Group point-of-sale data
Fiscal 2007 Goals
• Implementing our customer-centric
operating model at all U.S. Best Buy
stores
• Continuing to add new stores and
Magnolia Home Theater locations
• Building our Best Buy For Business
capabilities and presence
• Further growing our services business
• Enhancing our ability to provide
complete, end-to-end solutions
• Carefully pursuing international
growth opportunities
Best Buy U.S. Market Share
(calendar year data)
We believe that our market-share gains stem from
our heightened customer focus, differentiated
store experience and knowledgeable employees,
combined with our ability to offer total solutions.