Best Buy 2006 Annual Report Download - page 9
Download and view the complete annual report
Please find page 9 of the 2006 Best Buy annual report below. You can navigate through the pages in the report by either clicking on the pages listed below, or by using the keyword search tool below to find specific information within the annual report.-
 1
1 -
 2
2 -
 3
3 -
 4
4 -
 5
5 -
 6
6 -
 7
7 -
 8
8 -
 9
9 -
 10
10 -
 11
11 -
 12
12 -
 13
13 -
 14
14 -
 15
15 -
 16
16 -
 17
17 -
 18
18 -
 19
19 -
 20
20 -
21
-
22
-
23
-
24
-
25
-
26
-
27
-
28
-
29
-
30
-
31
-
32
-
33
-
34
-
35
-
36
-
37
-
38
-
39
-
40
-
41
-
42
-
43
-
44
-
45
-
46
-
47
-
48
-
49
-
50
-
51
-
52
-
53
-
54
-
55
-
56
-
57
-
58
-
59
-
60
-
61
-
62
-
63
-
64
-
65
-
66
-
67
-
68
-
69
-
70
-
71
-
72
-
73
-
74
-
75
-
76
-
77
-
78
-
79
-
80
-
81
-
82
-
83
-
84
-
85
-
86
-
87
-
88
-
89
-
90
-
91
-
92
-
93
-
94
-
95
-
96
-
97
-
98
-
99
-
100
-
101
-
102
-
103
-
104
-
105
-
106
-
107
-
108
-
109
-
110
-
111
-
112
-
113
-
114
-
115
-
116
-
117
-
118
 |
 |

Best Buy 2006 Annual Report 7
7
In essence, our goal is to deploy customer centricity in a cost-effective manner at all
U.S. Best Buy stores. This year is an opportune time for further change, as we are
expecting to benefit from the current product cycle. We anticipate comparable store
sales gains from flat-panel televisions, MP3 players and accessories, notebook com-
puters, video gaming consoles, Geek Squad services and appliances. Partially offset-
ting these gains will be declines from analog TVs, phones, computer printers and CDs.
Delivering On Growth
At the time this report was printed, based on our plans and current economic
expectations, we were expecting revenue of $34 billion to $35 billion for fiscal 2007,
an increase of 10 percent to 13 percent. We expected revenue growth from the new
store openings and a comparable store sales gain of 3 percent to 5 percent. We
also were anticipating earnings growth of approximately 20 percent. While we
believe this guidance range is achievable, we also recognize that the consumer elec-
tronics industry is very competitive, and our results could be affected by consumer
preferences, how well we execute our strategies and employee retention, among
other factors.
Longer term, we continue to pursue our goal of a 7-percent operating income rate.
Our earnings guidance for fiscal 2007 provides for an improvement of 40 basis
points. We expect the gain to come from improved capabilities in our supply chain
and information technology systems; leverage of our investments in Canada; and
organic growth fueled by new store openings, customer centricity work and the
expansion of our services business.
Leading Our People
Assisting me in working toward these goals are Brian Dunn, who was promoted
to president and COO, effective at the start of the fiscal year; Bob Willett, who was
named CEO of Best Buy International, effective the same date; and Darren Jackson
and Shari Ballard, who remain CFO and executive vice president of human capital,
respectively. I am honored to work alongside such a strong team of leaders.
Thanking Our Partners
Best Buy has a 40-year track record as a growth company. As we enter our fifth decade,
I would like to thank all of our partners who have contributed to our success. We are
indebted to our vendors, our communities and our shareholders for their support in
the past, today and in the future. Most of all, I would like to recognize our employees,
who make a difference for our customers every day. As I have said before, I believe
that we have only scratched the surface in realizing the opportunities associated with
our customer centricity strategy. I feel very optimistic about the coming year and the
heights to which our strategy will take us in the years ahead.
BBrraaddbbuurryy HH.. AAnnddeerrssoonn
Vice Chairman and CEO
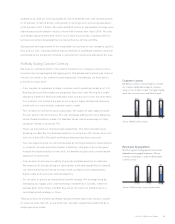
32%
Home Office
19%
Entertainment
Software
6%
Appliances
43%
Consumer
Electronics
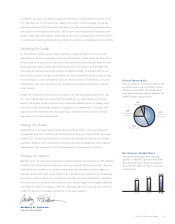
FY 06FY 05FY 04
$2.27
$1.86
$1.61
Product Revenue Mix
Consumer electronics increased to 43 percent of
our product revenue mix in fiscal 2006, up from
39 percent in fiscal 2005. This strength was pri-
marily driven by customer interest in flat-panel TVs,
and MP3 players and accessories.
Earnings per Diluted Share
Earnings per diluted share from continuing
operations increased 22 percent in fiscal 2006
driven by strong revenue growth, an improved
gross profit rate, higher net interest income and
a lower tax rate.