Caremark 2007 Annual Report Download - page 29
Download and view the complete annual report
Please find page 29 of the 2007 Caremark annual report below. You can navigate through the pages in the report by either clicking on the pages listed below, or by using the keyword search tool below to find specific information within the annual report.-
 1
1 -
2
-
3
-
4
-
5
-
6
-
7
-
8
-
9
-
10
-
11
-
12
-
13
-
14
-
15
-
16
-
17
-
18
-
 19
19 -
 20
20 -
 21
21 -
 22
22 -
 23
23 -
 24
24 -
 25
25 -
 26
26 -
 27
27 -
 28
28 -
 29
29 -
 30
30 -
 31
31 -
 32
32 -
 33
33 -
 34
34 -
 35
35 -
 36
36 -
 37
37 -
 38
38 -
 39
39 -
40
-
41
-
42
-
43
-
44
-
45
-
46
-
47
-
48
-
49
-
50
-
51
-
52
-
53
-
54
-
55
-
56
-
57
-
58
-
59
-
60
-
61
-
62
-
63
-
64
-
65
-
66
-
67
-
68
-
69
-
70
-
71
-
72
-
73
-
74
-
75
-
76
-
77
-
78
 |
 |

25 I 2007 Annual Report
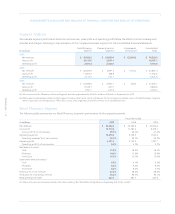
Pharmacy Services Segment
The following table summarizes our Pharmacy Services Segment’s performance for the respective periods:
Fiscal Year Ended
In millions 2007 2006 2005
Net revenues $ 34,938.4 $ 3,691.3 $ 2,956.7
Gross profit 2,997.1 458.8 345.5
Gross profit % of net revenues 8.6% 12.4% 11.7%
Operating expenses 895.1 140.7 123.1
Operating expenses % of net revenues 2.6% 3.8% 4.2%
Operating profit 2,102.0 318.1 222.4
Operating profit % of net revenues 6.0% 8.6% 7.5%
Net revenues:
Mail service $ 13,835.5 $ 2,935.4
Retail network 20,831.3 732.7
Other 271.6 23.2
Comparable Financial Information(1)
Net revenues $ 43,349.0 $ 40,514.0
Gross profit 3,557.6 2,848.8
Gross profit % of net revenues 8.2% 7.0%
Operating expenses 998.4 982.2
Operating expenses % of net revenues 2.3% 2.4%
Operating profit 2,559.2 1,866.6
Operating profit % of net revenues 5.9% 4.6%
Net revenues:
Mail service $ 16,790.7 $ 15,519.4
Retail network 26,218.9 24,668.3
Other 339.4 326.3
Pharmacy claims processed:
Total 607.2 605.9
Mail service 73.9 73.3
Retail network 533.3 532.6
Generic dispensing rate:
Total 60.1% 55.8%
Mail service 48.1% 43.3%
Retail network 61.7% 57.4%
Mail order penetration rate: 28.2% 28.0%
(1) The comparable financial information (above) combines the historical Pharmacy Services Segment results of CVS and Caremark assuming
the Caremark Merger occurred at the beginning of each period presented. The historical results of Caremark are based on calendar quarter/year
reporting periods, whereas the historical results of the Pharmacy Services Segment of CVS are based on a 52-week fiscal year ending on the
Saturday nearest to December 31. In each period presented, the comparable results include incremental depreciation and amortization resulting
from the preliminary fixed and intangible assets recorded in connection with the Caremark Merger and exclude merger-related expenses and
integration expenses. The comparable financial information has been provided for illustrative purposes only and does not purport to be
indicative of the actual results that would have been achieved by the combined business segment for the periods presented or that will
be achieved by the combined business segment in the future.