Cisco 2014 Annual Report Download - page 72
Download and view the complete annual report
Please find page 72 of the 2014 Cisco annual report below. You can navigate through the pages in the report by either clicking on the pages listed below, or by using the keyword search tool below to find specific information within the annual report.-
 1
1 -
2
-
3
-
4
-
5
-
6
-
7
-
8
-
9
-
10
-
11
-
12
-
13
-
14
-
15
-
16
-
17
-
18
-
19
-
20
-
21
-
22
-
23
-
24
-
25
-
26
-
27
-
28
-
29
-
30
-
31
-
32
-
33
-
34
-
35
-
36
-
37
-
38
-
39
-
40
-
41
-
42
-
43
-
44
-
45
-
46
-
47
-
48
-
49
-
50
-
51
-
52
-
53
-
54
-
55
-
56
-
57
-
58
-
59
-
60
-
61
-
 62
62 -
 63
63 -
 64
64 -
 65
65 -
 66
66 -
 67
67 -
 68
68 -
 69
69 -
 70
70 -
 71
71 -
 72
72 -
 73
73 -
 74
74 -
 75
75 -
 76
76 -
 77
77 -
 78
78 -
 79
79 -
 80
80 -
 81
81 -
 82
82 -
83
-
84
-
85
-
86
-
87
-
88
-
89
-
90
-
91
-
92
-
93
-
94
-
95
-
96
-
97
-
98
-
99
-
100
-
101
-
102
-
103
-
104
-
105
-
106
-
107
-
108
-
109
-
110
-
111
-
112
-
113
-
114
-
115
-
116
-
117
-
118
-
119
-
120
-
121
-
122
-
123
-
124
-
125
-
126
-
127
-
128
-
129
-
130
-
131
-
132
-
133
-
134
-
135
-
136
-
137
-
138
-
139
-
140
 |
 |

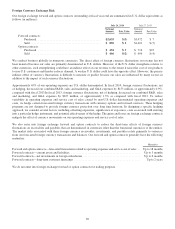
Deferred Revenue The following table presents the breakdown of deferred revenue (in millions):
July 26, 2014 July 27, 2013
Increase
(Decrease)
Service .............................................. $ 9,640 $ 9,403 $237
Product .............................................. 4,502 4,020 482
Total ............................................ $14,142 $13,423 $719
Reported as:
Current .......................................... $ 9,478 $ 9,262 $216
Noncurrent ....................................... 4,664 4,161 503
Total ........................................ $14,142 $13,423 $719
The increase in deferred service revenue in fiscal 2014 reflects the impact of new contract initiations and renewals, partially
offset by an increase in customers paying technical support service contracts over time and the impact of ongoing amortization
of deferred service revenue. The increase in deferred product revenue was primarily due to increased deferrals related to
subscription revenue arrangements and to a lesser extent, due to an increase in shipments not having met revenue recognition
criteria as of July 26, 2014.
Contractual Obligations
The impact of contractual obligations on our liquidity and capital resources in future periods should be analyzed in conjunction
with the factors that impact our cash flows from operations discussed previously. In addition, we plan for and measure our
liquidity and capital resources through an annual budgeting process. The following table summarizes our contractual
obligations at July 26, 2014 (in millions):
PAYMENTS DUE BY PERIOD
July 26, 2014 Total
Less than
1 Year
1to3
Years
3to5
Years
More than
5 Years
Operating leases ................................................ $ 1,239 $ 399 $ 457 $ 196 $ 187
Purchase commitments with contract manufacturers and suppliers ......... 4,169 4,169 — — —
Other purchase obligations ........................................ 896 534 316 45 1
Long-term debt ................................................. 20,754 500 8,004 4,250 8,000
Other long-term liabilities ........................................ 1,379 — 505 55 819
Total by period ............................................. $28,437 $5,602 $9,282 $4,546 $9,007
Other long-term liabilities (uncertainty in the timing of future payments) . . . 2,220
Total ................................................. $30,657
Operating Leases For more information on our operating leases, see Note 12 to the Consolidated Financial Statements.
Purchase Commitments with Contract Manufacturers and Suppliers We purchase components from a variety of suppliers and
use several contract manufacturers to provide manufacturing services for our products. A significant portion of our reported
estimated purchase commitments arising from these agreements are firm, noncancelable, and unconditional commitments. We
record a liability for firm, noncancelable, and unconditional purchase commitments for quantities in excess of our future
demand forecasts consistent with the valuation of our excess and obsolete inventory. See further discussion in “Inventory
Supply Chain.” As of July 26, 2014, the liability for these purchase commitments was $162 million and is recorded in other
current liabilities and is not included in the preceding table.
Other Purchase Obligations Other purchase obligations represent an estimate of all contractual obligations in the ordinary
course of business, other than operating leases and commitments with contract manufacturers and suppliers, for which we have
not received the goods or services. Purchase orders are not included in the preceding table as they typically represent our
authorization to purchase rather than binding contractual purchase obligations.
Long-Term Debt The amount of long-term debt in the preceding table represents the principal amount of the respective debt
instruments. See Note 10 to the Consolidated Financial Statements.
64