Cisco 2014 Annual Report Download - page 96
Download and view the complete annual report
Please find page 96 of the 2014 Cisco annual report below. You can navigate through the pages in the report by either clicking on the pages listed below, or by using the keyword search tool below to find specific information within the annual report.-
 1
1 -
2
-
3
-
4
-
5
-
6
-
7
-
8
-
9
-
10
-
11
-
12
-
13
-
14
-
15
-
16
-
17
-
18
-
19
-
20
-
21
-
22
-
23
-
24
-
25
-
26
-
27
-
28
-
29
-
30
-
31
-
32
-
33
-
34
-
35
-
36
-
37
-
38
-
39
-
40
-
41
-
42
-
43
-
44
-
45
-
46
-
47
-
48
-
49
-
50
-
51
-
52
-
53
-
54
-
55
-
56
-
57
-
58
-
59
-
60
-
61
-
62
-
63
-
64
-
65
-
66
-
67
-
68
-
69
-
70
-
71
-
72
-
73
-
74
-
75
-
76
-
77
-
78
-
79
-
80
-
81
-
82
-
83
-
84
-
85
-
 86
86 -
 87
87 -
 88
88 -
 89
89 -
 90
90 -
 91
91 -
 92
92 -
 93
93 -
 94
94 -
 95
95 -
 96
96 -
 97
97 -
 98
98 -
 99
99 -
 100
100 -
 101
101 -
 102
102 -
 103
103 -
 104
104 -
 105
105 -
 106
106 -
107
-
108
-
109
-
110
-
111
-
112
-
113
-
114
-
115
-
116
-
117
-
118
-
119
-
120
-
121
-
122
-
123
-
124
-
125
-
126
-
127
-
128
-
129
-
130
-
131
-
132
-
133
-
134
-
135
-
136
-
137
-
138
-
139
-
140
 |
 |

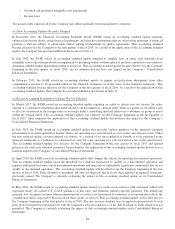
4. Goodwill and Purchased Intangible Assets
(a) Goodwill
The following tables present the goodwill allocated to the Company’s reportable segments as of July 26, 2014 and July 27,
2013, as well as the changes to goodwill during fiscal 2014 and 2013 (in millions):
Balance at
July 27, 2013 Acquisitions Other
Balance at
July 26, 2014
Americas ............................................... $13,800 $1,275 $ 5 $15,080
EMEA ................................................. 5,037 681 (3) 5,715
APJC .................................................. 3,082 362 — 3,444
Total .............................................. $21,919 $2,318 $ 2 $24,239
Balance at
July 28, 2012
NDS
Acquisition
Other
Acquisitions Other
Balance at
July 27, 2013
Americas ............................................... $11,755 $1,230 $ 828 $ (13) $13,800
EMEA ................................................. 3,287 1,327 411 12 5,037
APJC .................................................. 1,956 887 230 9 3,082
Total .............................................. $16,998 $3,444 $1,469 $ 8 $21,919
(b) Purchased Intangible Assets
The following tables present details of the Company’s intangible assets acquired through business combinations completed
during fiscal 2014 and 2013 (in millions, except years):
FINITE LIVES
INDEFINITE
LIVES
TOTALTECHNOLOGY
CUSTOMER
RELATIONSHIPS OTHER IPR&D
Fiscal 2014
Weighted-
Average Useful
Life (in Years) Amount
Weighted-
Average Useful
Life (in Years) Amount
Weighted-
Average Useful
Life (in Years) Amount Amount Amount
Composite Software, Inc. ..... 6.0 $60 3.9 $14 — $— $ 1 $75
Sourcefire, Inc. ............. 7.0 400 5.0 129 3.0 26 22 577
WhipTail Technologies, Inc. .. 5.0 63 5.0 1 2.7 3 38 105
Tail-f Systems .............. 7.0 55 6.8 6 — — — 61
All others (four in total) ...... 3.6 18 4.0 2 — — — 20
Total .................. $596 $152 $ 29 $ 61 $838
FINITE LIVES
INDEFINITE
LIVES
TOTALTECHNOLOGY
CUSTOMER
RELATIONSHIPS OTHER IPR&D
Fiscal 2013
Weighted-
Average Useful
Life (in Years) Amount
Weighted-
Average Useful
Life (in Years) Amount
Weighted-
Average Useful
Life (in Years) Amount Amount Amount
NDS Group Limited ........ 6.4 $ 807 6.7 $818 7.4 $ 27 $ 94 $1,746
Meraki, Inc. ............... 8.0 259 6.0 30 — — — 289
Intucell, Ltd. .............. 5.0 59 5.0 11 — — 36 106
Ubiquisys Limited .......... 4.0 66 5.0 7 — — 50 123
All others (nine in total) ...... 4.7 95 5.8 17 5.0 1 14 127
Total ................. $1,286 $883 $ 28 $194 $2,391
88