Costco 1998 Annual Report Download - page 10
Download and view the complete annual report
Please find page 10 of the 1998 Costco annual report below. You can navigate through the pages in the report by either clicking on the pages listed below, or by using the keyword search tool below to find specific information within the annual report.-
 1
1 -
 2
2 -
 3
3 -
 4
4 -
 5
5 -
 6
6 -
 7
7 -
 8
8 -
 9
9 -
 10
10 -
 11
11 -
 12
12 -
 13
13 -
 14
14 -
 15
15 -
 16
16 -
 17
17 -
 18
18 -
 19
19 -
 20
20 -
 21
21 -
22
-
23
-
24
-
25
-
26
-
27
-
28
-
29
-
30
-
31
-
32
-
33
-
34
-
35
-
36
-
37
-
38
-
39
-
40
 |
 |

MERRILL CORPORATION NETWORK COMPOSITION SYSTEM LSTARKE // 9-DEC-98 18:21 DISK004:[98SEA7.98SEA2097]DL2097A.;9
IMAGES:[PAGER.PSTYLES]MRLL.BST;4 pag$fmt:mrll.fmt Free: 347DM/ 0D Foot: 0D/ 0D VJ R Seq: 1 Clr: 0
COSTCO COMPANIES A/R (Y/E 8-31-98) Proj: P1826SEA98 Job: 98SEA2097 File: DL2097A.;9
Merrill/Seattle (206) 623-5606 Page Dim: 8.250N X 10.750NCopy Dim: 42. X 54.3
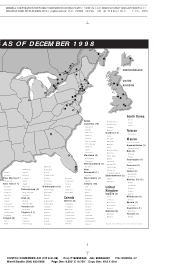
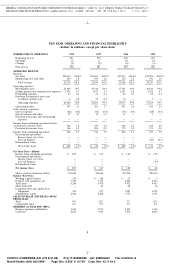
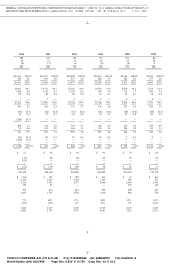
TEN YEAR OPERATING AND FINANCIAL HIGHLIGHTS
(dollars in millions, except per share data)
1998 1997 1996 1995WAREHOUSES IN OPERATION
Beginning of year 261 252 240 221
Openings 18 17 20 24
Closings (1) (8) (8) (5)
End of year 278 261 252 240
OPERATING RESULTS
Revenue
Net sales $23,830 100.0% $21,484 100.0% $19,214 100.0% $17,906 100.0%
Membership fees and other 440 1.8 390 1.8 352 1.8 341 1.9
Total revenue 24,270 101.8 21,874 101.8 19,566 101.8 18,247 101.9
Operating expenses
Merchandise costs 21,380 89.7 19,314 89.9 17,345 90.3 16,226 90.6
Selling, general and administrative expenses 2,070 8.7 1,877 8.7 1,691 8.8 1,556 8.7
Preopening expenses 27 0.1 27 0.1 29 0.1 25 0.1
Provision for impaired assets and
warehouse closing costs 6 0.0 75 0.4 10 — 7 —
Operating expenses 23,483 98.5 21,293 99.1 19,075 99.2 17,814 99.5
Operating income 787 3.3 581 2.7 491 2.6 433 2.4
Other income (expenses)
Interest expense (48) (0.2) (76) (0.4) (78) (0.4) (68) (0.4)
Interest income and other 27 0.1 15 0.1 11 — 3 —
Provision for merger and restructuring
expenses — — — — — — — —
Income from continuing operations before
provision for income taxes 766 3.2 520 2.4 424 2.2 368 2.0
Provision for income taxes 306 1.3 208 0.9 175 0.9 151 0.8
Income from continuing operations 460 1.9 312 1.5 249 1.3 217 1.2
Discontinued operations:
Income (loss), net of tax — — — — — — — —
Loss on disposal — — — — — — (83) (0.5)
Extraordinary items — — — — — — — —
Net income (loss) $ 460 1.9% $ 312 1.5% $ 249 1.3% $ 134 0.7%
Per Share Data—Diluted
Income from continuing operations $ 2.03 $ 1.47 $ 1.22 $ 1.05
Discontinued operations:
Income (loss), net of tax ————
Loss on disposal — — — (.37)
Extraordinary items ————
Net income (loss) $ 2.03 $ 1.47 $ 1.22 $ .68
Shares used in calculation (000’s) 231,685 224,668 217,890 223,610
Balance Sheet Data
Working capital (deficit) 431 $ 146 $ 57 $ 9
Property and equipment, net 3,395 3,155 2,888 2,535
Total assets 6,260 5,476 4,912 4,437
Short-term debt — 25 60 76
Long-term debt and capital lease
obligations 930 917 1,229 1,095
Stockholders’ equity 2,966 2,468 1,778 1,531
SALES INCREASE (DECREASE) FROM
PRIOR YEAR
Total 11% 12% 7% 11%
Comparable units 8% 9% 5% 2%
MEMBERS AT YEAR END (000’s)
Business (primary cardholders) 3,676 3,537 3,435 3,318
Gold Star 8,654 7,845 7,076 6,683
8
9 C Cs: 26113