Costco 1998 Annual Report Download - page 3
Download and view the complete annual report
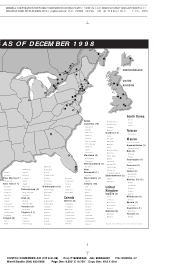
Please find page 3 of the 1998 Costco annual report below. You can navigate through the pages in the report by either clicking on the pages listed below, or by using the keyword search tool below to find specific information within the annual report.-
 1
1 -
 2
2 -
 3
3 -
 4
4 -
 5
5 -
 6
6 -
 7
7 -
 8
8 -
 9
9 -
 10
10 -
 11
11 -
 12
12 -
 13
13 -
 14
14 -
15
-
16
-
17
-
18
-
19
-
20
-
21
-
22
-
23
-
24
-
25
-
26
-
27
-
28
-
29
-
30
-
31
-
32
-
33
-
34
-
35
-
36
-
37
-
38
-
39
-
40
 |
 |

MERRILL CORPORATION NETWORK COMPOSITION SYSTEM LSTARKE // 9-DEC-98 19:50 DISK004:[98SEA7.98SEA2097]DE2097A.;7
IMAGES:[PAGER.PSTYLES]MRLL.BST;4 pag$fmt:mrll.fmt Free: 490DM/ 0D Foot: 0D/ 0D VJ R Seq: 1 Clr: 0
COSTCO COMPANIES A/R (Y/E 8-31-98) Proj: P1826SEA98 Job: 98SEA2097 File: DE2097A.;7
Merrill/Seattle (206) 623-5606 Page Dim: 8.250N X 10.750NCopy Dim: 38. X 54.3
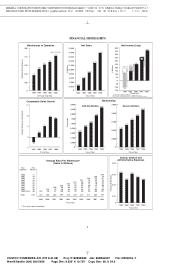
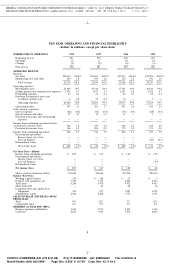
FINANCIAL HIGHLIGHTS
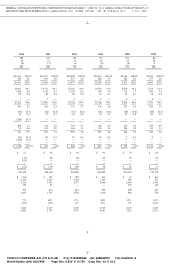
1994 1995 1996 1997 1998
3,537
Discontinued Operations
Merger Costs
191**
–112
Discont’d Ops
217*
1995
$ Millions
Fiscal Year
Net Income/(Loss)
Selling, General and
Administrative Expenses
Percent of Net Sales
Percent Increase / (Decrease)
Fiscal Year
Comparable Sales Growth
1994 1995 1996 1997 1998
Gold Star Members___________________
1994 1995 1996 1997
3,000
3,200
3,400
3,800 Business Members___________________
Membership
0
* First year sales annualized.
Average Sales Per Warehouse*
(Sales In Millions)
Year
Opened
# of
Whses*
1989 1990 1991 1992 1993 1994 1995 1996 1997
$81
$81
$55
89
$83
$49
73
97
$86
$48
58
86
100
$84
$59
54
60
86
95
$78
$57
62
61
63
86
92
$76
$51
60
69
65
64
85
90
$75
$46
58
68
74
69
67
87
93
$77
1998
1997
1996
1995
1994
1993
1992
1991
1990
1989
Totals
17
10
18
19
27
34
26
20
18
89
278
& Before
3,435
1998
$50
70
61
76
83
84
80
77
99
107
$87
1998
Number of Warehouses
At Fiscal Year End
(285 at 12/31/98)
Warehouses In Operation
240
Thousands
0
221
1996
250
225
200
0
300
275
7,000
6,500
6,000
5,500
5,000
8,000
3,318
$56
53
69
76
79
75
71
93
100
$83
9,000
8.4%
8.8%
8.6%
9.0%
0
1997
1994
252 249*
7,500
8,500
3,600
1994 1995 1996 1997 1998
$ Millions
Fiscal Year
0
25,000
1994 1995 1996 1997 1998
Net Sales
16,161
21,484
17,906
1998
Fiscal Year
Fiscal Year
Fiscal Year
Fiscal Year
–5
0
15
10
5
134
261
19,214
24,000
23,000
22,000
21,000
20,000
19,000
18,000
17,000
16,000
100
0
1994 1995 1996 1997 1998
312*
7,845
6,088
6,683
7,076
3,228
50
150
200
250
300
350
500
-50
–100
–150
351***
Asset Impairment
*Income from continuing operations
**Income from continuing operations excluding merger costs
***Income from continuing operations excluding asset impairment charge
8.82%
8.74%
8.80%
8.69%
–3%
2%
5%
9%
8%
278
23,830
400
450 460*
3,676
8,654
111*
8.69%
1
9 C Cs: 56200