Costco 2002 Annual Report Download - page 11
Download and view the complete annual report
Please find page 11 of the 2002 Costco annual report below. You can navigate through the pages in the report by either clicking on the pages listed below, or by using the keyword search tool below to find specific information within the annual report.-
 1
1 -
 2
2 -
 3
3 -
 4
4 -
 5
5 -
 6
6 -
 7
7 -
 8
8 -
 9
9 -
 10
10 -
 11
11 -
 12
12 -
 13
13 -
 14
14 -
 15
15 -
 16
16 -
 17
17 -
 18
18 -
 19
19 -
 20
20 -
 21
21 -
 22
22 -
23
-
24
-
25
-
26
-
27
-
28
-
29
-
30
-
31
-
32
-
33
-
34
-
35
-
36
-
37
-
38
-
39
-
40
-
41
-
42
-
43
-
44
-
45
-
46
-
47
 |
 |
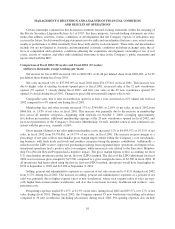
MANAGEMENT’S DISCUSSION AND ANALYSIS OF FINANCIAL CONDITION
AND RESULTS OF OPERATIONS
Certain statements contained in this document constitute forward-looking statements within the meaning of
the Private Securities Litigation Reform Act of 1995. For these purposes, forward-looking statements are state-
ments that address activities, events, conditions or developments that the Company expects or anticipates may
occur in the future. Such forward-looking statements involve risks and uncertainties that may cause actual events,
results or performance to differ materially from those indicated by such statements. These risks and uncertainties
include, but are not limited to, domestic and international economic conditions including exchange rates, the ef-
fects of competition and regulation, conditions affecting the acquisition, development, ownership or use of real
estate, actions of vendors, and other risks identified from time to time in the Company’s public statements and
reports filed with the SEC.
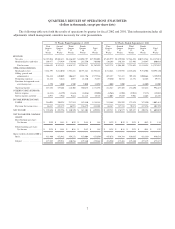
Comparison of Fiscal 2002 (52 weeks) and Fiscal 2001 (52 weeks):
(dollars in thousands, except earnings per share)
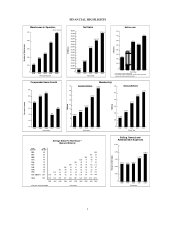
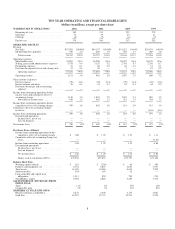
Net income for fiscal 2002 increased 16% to $699,983, or $1.48 per diluted share, from $602,089, or $1.29
per diluted share during fiscal year 2001.
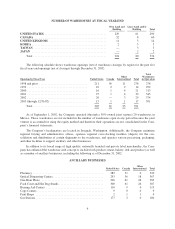
Net sales increased 11% to $37,993,093 in fiscal 2002 from $34,137,021 in fiscal 2001. This increase was
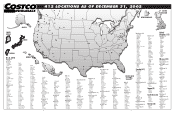
due to higher sales at existing locations opened prior to fiscal 2001; increased sales at the 32 new warehouses
opened (39 opened, 7 closed) during fiscal 2001; and first year sales at the 29 new warehouses opened (35
opened, 6 closed) during fiscal 2002. Changes in prices did not materially impact sales levels.
Comparable sales, that is sales in warehouses open for at least a year, increased at a 6% annual rate in fiscal
2002 compared to a 4% annual rate during fiscal 2001.
Membership fees and other revenue increased 17% to $769,406, or 2.03% of net sales, in fiscal 2002 from
$660,016, or 1.93% of net sales, in fiscal 2001. This increase was primarily due to the increase in membership
fees across all member categories—beginning with renewals on October 1, 2000, averaging approximately
five dollars per member; additional membership sign-ups at the 29 new warehouses opened in fiscal 2002; and
increased penetration of the Company’s Executive Membership. Overall, member renewal rates remained con-
sistent with the prior year, currently at 86%.
Gross margin (defined as net sales minus merchandise costs) increased 13% to $4,009,972, or 10.55% of net
sales, in fiscal 2002 from $3,538,881, or 10.37% of net sales, in fiscal 2001. The increase in gross margin as a
percentage of net sales reflects merchandise gross margin improvement within the Company’s core merchandis-
ing business, with fresh foods and foods and sundries categories being the primary contributors. Additionally, a
reduction in the LIFO reserve, improved purchasing resulting from expanded depot operations and improved in-
ternational operations had a positive effect on margins, while increased costs related to the Executive Member-
ship Two-Percent Reward Program had a negative impact. The gross margin figures reflect accounting for most
U.S. merchandise inventories on the last-in, first-out (LIFO) method. The effect of the LIFO adjustment for fiscal
2002 was to increase gross margin by $13,500, compared to a gross margin decrease of $5,500 in fiscal 2001. If
all inventories had been valued using the first-in, first-out (FIFO) method, inventories would have been higher by
$150 at September 1, 2002 and $13,650 at September 2, 2001.
Selling, general and administrative expenses as a percent of net sales increased to 9.41% during fiscal 2002
from 9.17% during fiscal 2001. The increase in selling, general and administrative expenses as a percent of net
sales was primarily due to higher expense ratios at new warehouses, where such expense ratios to sales are typi-
cally higher than at more mature warehouses; and also due to increases in salary, healthcare and workers’ com-
pensation costs.
Preopening expenses totaled $51,257, or 0.13% of net sales, during fiscal 2002 and $59,571, or 0.17% of net
sales, during fiscal 2001. During fiscal 2002, the Company opened 35 new warehouses (including relocations)
compared to 39 new warehouses (including relocations) during fiscal 2001. Pre-opening expenses also include
10