Federal Express 2011 Annual Report Download
Download and view the complete annual report
Please find the complete 2011 Federal Express annual report below. You can navigate through the pages in the report by either clicking on the pages listed below, or by using the keyword search tool below to find specific information within the annual report.-
 1
1 -
 2
2 -
 3
3 -
 4
4 -
 5
5 -
 6
6 -
 7
7 -
 8
8 -
 9
9 -
 10
10 -
 11
11 -
 12
12 -
13
-
14
-
15
-
16
-
17
-
18
-
19
-
20
-
21
-
22
-
23
-
24
-
25
-
26
-
27
-
28
-
29
-
30
-
31
-
32
-
33
-
34
-
35
-
36
-
37
-
38
-
39
-
40
-
41
-
42
-
43
-
44
-
45
-
46
-
47
-
48
-
49
-
50
-
51
-
52
-
53
-
54
-
55
-
56
-
57
-
58
-
59
-
60
-
61
-
62
-
63
-
64
-
65
-
66
-
67
-
68
-
69
-
70
-
71
-
72
-
73
-
74
-
75
-
76
-
77
-
78
-
79
-
80
 |
 |

FEDEX ANNUAL REPORT 2011
Table of contents
-
Page 1
FEDEX ANNUAL REPORT 2011 -
Page 2
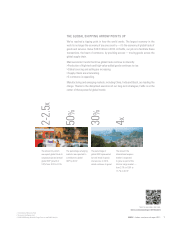
POWERFUL, LONG-TERM TRENDS IN GLOBAL TRADE REVOLVE AROUND FEDEX. -
Page 3
... markets, including China, India and Brazil, are leading the charge. Thanks to the disciplined execution of our long-term strategies, FedEx is at the center of these powerful global trends: 2-2.5x 50% 30% The percentage of global GDP represented by total trade in goods and services in 2010... -
Page 4
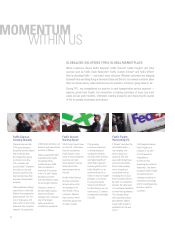
...., is an example of how we're using highly automated processes to sort 3.5 million ground packages a day across our network. For online retailers and direct marketers who need a cost-effective option to ship low-weight packages to residential customers, FedEx SmartPost® is increasingly the solution... -
Page 5
...'RE REAPING " THE BENEFITS OF The new FedEx Data Center in Colorado Springs represents a major milestone in our commitment to use advanced technologies to beneï¬t our customers. It not only supports our plans for growth but also provides an additional level of data protection. It's LEED-certiï¬ed... -
Page 6
... LTL > The growing e-commerce economy is driving increased residential deliveries via FedEx Home Delivery and FedEx SmartPost®, which had 31 percent revenue growth in FY11. FedEx SmartPost is an economical way for etailers to ship low-weight packages to customers. By using the United States... -
Page 7
...secure end-to-end service that relies on nonhazardous technology to maintain extremely low temperatures for days. > Newly combined package and freight sales teams focus on selling an unmatched portfolio of express, ground and LTL solutions. > FedEx® Deep Frozen Shipping Solution uses nonhazardous... -
Page 8
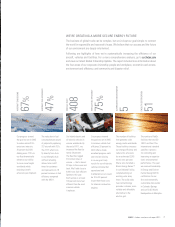
WE'RE MAKING EXCELLENT PROGRESS TOWARD GREATER FUEL EFFICIENCY AND IMPLEMENTING ALTERNATIVE SOURCES OF ENERGY. 6 -
Page 9
... a process for controlling and improving an organization's environmental performance. This year we received Leadership in Energy and Environmental Design (LEED) certiï¬cation for our ï¬rst environmentally sustainable data center in Colorado Springs and our FedEx World Headquarters in Memphis. 51... -
Page 10
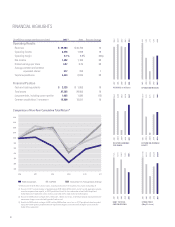
... 2007 2009(2) 2007 2010 2011 DILUTED EARNINGS PER SHARE RETURN ON AVERAGE EQUITY FedEx Corporation S&P 500 Dow Jones U.S. Transportation Average *$100 invested on 5/31/06 in stock or index, including reinvestment of dividends. Fiscal year ending May 31. (1) Results for 2011 include charges of... -
Page 11
... average daily volume and shipment weight; > the mix of services purchased by our customers; > the prices we obtain for our services, primarily measured by yield (revenue per package or pound or revenue per hundredweight for LTL freight shipments); > our ability to manage our cost structure (capital... -
Page 12
... by reportable segment for 2011 compared to 2010, and 2010 compared to 2009 (dollars in millions): Revenues Dollar Change 2011/2010 2010/2009 Percent Change 2011/2010 2010/2009 2011/2010 Operating Income Dollar Change 2010/2009 Percent Change 2011/2010 2010/2009 FedEx Express segment FedEx Ground... -
Page 13
... customers opted for lower-priced ground transportation services and we continued to gain market share. Despite higher shipment volumes in 2010, our FedEx Freight segment had a difï¬cult year, resulting in an operating loss caused by the highly competitive pricing environment in the LTL market due... -
Page 14
...353 85.0 90.0 FedEx Freight Average Daily LTL Shipments 86.0 82.3 79.7 74.4 70.0 2008 2009 2010 2011 2008 2009 2010 2011 The following graphs for FedEx Express, FedEx Ground and FedEx Freight show selected yield trends for the years ended May 31: FedEx Express Revenue per Package - Yield $23.00... -
Page 15
... lawsuit against FedEx Express. Percent of Revenue 2011 2010 2009 Operating expenses: Salaries and employee beneï¬ts Purchased transportation Rentals and landing fees Depreciation and amortization Fuel Maintenance and repairs Impairment and other charges Other Total operating expenses Operating... -
Page 16
... 401(k) company-matching contributions effective January 1, 2011. Purchased transportation increased 20% in 2011 due to volume growth, higher fuel surcharges and higher rates paid to our independent contractors at FedEx Ground, as well as costs associated with the expansion of our freight forwarding... -
Page 17
... unmatched global network is The components of the provision for federal income taxes for the years uniquely positioned to service customer needs in this sector. While ended May 31 were as follows (in millions): cost headwinds in pension plans and maintenance and repairs are 2011 2010 2009 expected... -
Page 18
...) FedEx Ground Segment > FedEx Ground (small-package ground delivery) > FedEx SmartPost (small-parcel consolidator) > FedEx Freight (LTL freight transportation) > FedEx Custom Critical (time-critical transportation) FedEx Services Segment > FedEx Services (sales, marketing and information technology... -
Page 19
... 19 (3) Total freight revenue caption also includes charges and credits for administrative services (2) Other 838 525 465 60 13 provided between operating companies and certain other costs such 24,581 21,555 22,364 14 (4) Total revenues as corporate management fees related to services received for... -
Page 20
...6.0 1.2 (1) 2011 2010 2009 Package Statistics(1) Average daily package volume (ADV): U.S. overnight box U.S. overnight envelope U.S. deferred Total U.S. domestic ADV International priority International domestic(2) Total ADV Revenue per package (yield): U.S. overnight box U.S. overnight envelope... -
Page 21
... weights and favorable exchange rates. Our fuel surcharges are indexed to the spot price for jet fuel. Using this index, the U.S. domestic and outbound fuel surcharge and the international fuel surcharges ranged as follows for the years ended May 31: 2011 2010 2009 FedEx Express Segment Operating... -
Page 22
... SmartPost Total revenues Operating expenses: Salaries and employee beneï¬ts Purchased transportation Rentals Depreciation and amortization Fuel Maintenance and repairs Intercompany charges Other Total operating expenses Operating income Operating margin Average daily package volume: FedEx Ground... -
Page 23
... primarily due to FedEx SmartPost average daily volume grew 17% during 2011 primar- volume growth, higher fuel costs and higher rates paid to our indepenily as a result of growth in e-commerce business, gains in market dent contractors. Salaries and employee beneï¬ts expense increased share and the... -
Page 24
... system and improved transit time across numerous shipping lanes. However, we expect to incur higher purchased transportation costs due to higher rates paid to our independent contractors and higher variable incentive compensation in 2012. We are committed to investing in the FedEx Ground network... -
Page 25
... of discounted pricing in contracts signed during 2010. In 2010, FedEx Freight segment revenues decreased primarily due to lower LTL yield and the merger of Caribbean Transportation Services into FedEx Express effective June 1, 2009, mostly offset by higher average daily LTL shipments. LTL yield... -
Page 26
... ANALYSIS FINANCIAL CONDITION LIQUIDITY Cash and cash equivalents totaled $2.3 billion at May 31, 2011, compared to $2.0 billion at May 31, 2010. The following table provides a summary of our cash ï¬,ows for the periods ended May 31 (in millions): 2011 2010 2009 CASH USED IN INVESTING ACTIVITIES... -
Page 27
... Change 2011 2010 2009 2011/ 2010 2010/ 2009 Aircraft and related equipment $ 1,988 $ 1,537 $ 925 Facilities and sort equipment Vehicles Information and technology investments Other equipment Total capital expenditures FedEx Express segment FedEx Ground segment FedEx Freight segment FedEx Services... -
Page 28
... In accordance with accounting principles generally accepted in the United States, future contractual payments under our operating leases (totaling $14.0 billion on an undiscounted basis) are not recorded in our balance sheet. Credit rating agencies routinely use information concerning minimum lease... -
Page 29
... of our plan assets and the discount rate used to measure our pension liabilities at a single point in time at the end of our ï¬scal year (the measurement date). Both of these factors are signiï¬cantly inï¬,uenced by the stock and bond markets, which in recent years have experienced substantial... -
Page 30
... 42 $ 486 $ 177 237 57 $ 471 PENSION COST. The accounting for pension and postretirement healthcare plans includes numerous assumptions, such as: discount rates; expected long-term investment returns on plan assets; future salary increases; employee turnover; mortality; and retirement ages. These... -
Page 31
...of our strategy to manage future pension costs and net funded status volatility, we have transitioned to a liability-driven investment strategy with a greater concentration of ï¬xed-income securities to better align plan assets with liabilities. We review the expected long-term rate of return on an... -
Page 32
... manager fees, for the 15-year period ended May 31, 2011 and 7.9%, net of investment manager fees, for the 15-year period ended May 31, 2010. Pension expense is also affected by the accounting policy used to determine the value of plan assets at the measurement date. We use a calculated-value method... -
Page 33
... for operating leases are not reï¬,ected as a liability in our balance sheet under current U.S. accounting rules. LONG-LIVED ASSETS PROPERTY AND EQUIPMENT. Our key businesses are capital intensive, with approximately 57% of our total assets invested in our transportation and information systems... -
Page 34
... our LTL networks in 2011, this unit was merged into the FedEx Freight reporting unit. Goodwill Impairment Charges - 2009 FEDEX OFFICE. During 2009, in response to the lower revenues and continued operating losses at FedEx Ofï¬ce resulting from the U.S. recession, the company initiated an internal... -
Page 35
... income tax liabilities are recorded in the caption "Other liabilities" in the accompanying consolidated balance sheets. We account for operating taxes based on multi-state, local and foreign taxing jurisdiction rules in those areas in which we operate. Provisions for operating taxes are estimated... -
Page 36
..., 2011 and $41 million as of May 31, 2010. The underlying fair values of our long-term debt were estimated based on quoted market prices or on the current rates offered for debt with similar terms and maturities. COMMODITY. While we have market risk for changes in the price of jet and vehicle fuel... -
Page 37
...or increase our prices (including our fuel surcharges in response to rising fuel costs), but also to maintain or grow our market share. In addition, maintaining a broad portfolio of services is important to keeping and attracting customers. While we believe we compete effectively through our current... -
Page 38
...employment and withholding tax and beneï¬t liability for FedEx Ground, and could result in changes to the independent contractor status of FedEx Ground's owner-operators. If FedEx Ground is compelled to convert its independent contractors to employees, labor organizations could more easily organize... -
Page 39
... from new domestic or international government laws and regulation; > changes in foreign currency exchange rates, especially in the euro, Chinese yuan, Canadian dollar, British pound and Japanese yen, which can affect our sales levels and foreign currency sales prices; FORWARD-LOOKING STATEMENTS... -
Page 40
... over ï¬nancial reporting as of May 31, 2011, has been audited by Ernst & Young LLP, the independent registered public accounting ï¬rm who also audited the Company's consolidated ï¬nancial statements included in this Annual Report. Ernst & Young LLP's report on the Company's internal control over... -
Page 41
... with the standards of the Public Company Accounting Oversight Board (United States), the consolidated balance sheets of FedEx Corporation as of May 31, 2011 and 2010, and the related consolidated statements of income, changes in stockholders' investment and comprehensive income, and cash ï¬,ows for... -
Page 42
FEDEX CORPORATION CONSOLIDATED STATEMENTS OF INCOME Years ended May 31, (in millions, except per share amounts) 2011 2010 2009 Revenues Operating Expenses: Salaries and employee beneï¬ts Purchased transportation Rentals and landing fees Depreciation and amortization Fuel Maintenance and ... -
Page 43
FEDEX CORPORATION CONSOLIDATED BALANCE SHEETS May 31, (in millions, except share data) 2011 2010 Assets Current Assets Cash and cash equivalents Receivables, less allowances of $182 and $166 Spare parts, supplies and fuel, less allowances of $169 and $170 Deferred income taxes Prepaid expenses ... -
Page 44
... accounts Deferred income taxes and other noncash items Impairment and other charges Stock-based compensation Changes in assets and liabilities: Receivables Other assets Pension assets and liabilities, net Accounts payable and other liabilities Other, net Cash provided by operating activities... -
Page 45
FEDEX CORPORATION CONSOLIDATED STATEMENTS OF CHANGES IN STOCKHOLDERS' INVESTMENT AND COMPREHENSIVE INCOME Common Stock Additional Paid-in Capital Retained Earnings Accumulated Other Comprehensive Income (Loss) Treasury Stock (in millions, except share data) Total Balance at May 31, 2008 ... -
Page 46
... in transit, revenue is recorded based on the percentage of service completed at the balance sheet date. Estimates for future billing adjustments to revenue and accounts receivable are recognized at the time of shipment for money-back service guarantees and billing corrections. Delivery costs are... -
Page 47
... in 2011, $80 million in 2010 and $71 million in 2009. PENSION AND POSTRETIREMENT HEALTHCARE PLANS. Our deï¬ned beneï¬t plans are measured using actuarial techniques that reï¬,ect management's assumptions for discount rate, expected long-term investment returns on plan assets, salary increases... -
Page 48
... Federal Express Corporation ("FedEx Express"), which represent a small number of FedEx Express's total employees, are employed under a collective bargaining agreement. During the fourth quarter of 2011, the pilots ratiï¬ed a new labor contract that includes safety initiatives, increases in hourly... -
Page 49
... have received $88 million related to asset sales, which offset the total cash outlays for the program. The estimates recorded at May 31, 2011 are not subject to any material risk of change. USE OF ESTIMATES. The preparation of our consolidated ï¬nancial statements requires the use of estimates and... -
Page 50
... to our transportation segments, as the charge was unrelated to the core performance of those businesses. FEDEX NATIONAL LTL. In 2009, we recorded a goodwill impairment charge of $90 million at our FedEx National LTL unit. This charge was a result of reduced revenues and increased operating losses... -
Page 51
... of various airport facilities and equipment. These bonds require interest payments at least annually, with principal payments due at the end of the related lease agreement. Senior unsecured debt Interest rate of 7.25%, due in 2011 Interest rate of 9.65%, due in 2013 Interest rate of 7.38%, due... -
Page 52
... Aircraft and Related Equipment Facilities and Other Total Operating Leases NOTE 9: STOCK-BASED COMPENSATION Our total stock-based compensation expense for the years ended May 31 was as follows (in millions): 2011 2010 2009 Stock-based compensation expense $ 98 $ 101 $ 99 2012 2013 2014 2015... -
Page 53
...is the annual rate of dividends per share over the exercise price of the option. An increase in the dividend yield will decrease compensation expense. The following table summarizes information about stock option activity for the year ended May 31, 2011: Stock Options Weighted-Average Exercise Price... -
Page 54
... TO CONSOLIDATED FINANCIAL STATEMENTS Our current federal income tax expenses in 2011, 2010, and 2009 were signiï¬cantly reduced by accelerated depreciation deductions we claimed under provisions of the Tax Relief and the Small Business Jobs Acts of 2010, the American Recovery and Reinvestment Tax... -
Page 55
... strategy. We ï¬le income tax returns in the U.S., various U.S. state and local jurisdictions, and various foreign jurisdictions. The Internal Revenue Service is currently auditing our consolidated U.S. income tax returns for the 2007 through 2009 tax years. We are no longer subject to U.S. federal... -
Page 56
... plan assets available to fund those obligations and the expected long-term rate of return on plan assets. We use a measurement date of May 31 for our pension and postretirement healthcare plans. Management reviews the assumptions used to measure pension costs on an annual basis. Economic and market... -
Page 57
... made strictly in indexed funds. Our estimated long-term rate of return on plan assets remains at 8% for 2012, consistent with our expected rate of return in 2011 and 2010. For the 15-year period ended May 31, 2011, our actual returns were 7.8%. The investment strategy for pension plan assets is to... -
Page 58
...TO CONSOLIDATED FINANCIAL STATEMENTS The fair values of investments by level and asset category and the weighted-average asset allocations for our domestic pension plans at the measurement date are presented in the following table (in millions): Plan Assets at Measurement Date 2011 Quoted Prices in... -
Page 59
...TO CONSOLIDATED FINANCIAL STATEMENTS The following table provides a reconciliation of the changes in the pension and postretirement healthcare plans' beneï¬t obligations and fair value of assets over the two-year period ended May 31, 2011 and a statement of the funded status as of May 31, 2011 and... -
Page 60
... TO CONSOLIDATED FINANCIAL STATEMENTS Our pension plans included the following components at May 31, 2011 and 2010 (in millions): ABO PBO Fair Value of Plan Assets Funded Status 2011 Qualiï¬ed Nonqualiï¬ed International Plans Total 2010 Qualiï¬ed Nonqualiï¬ed International Plans Total $ 16... -
Page 61
NOTES TO CONSOLIDATED FINANCIAL STATEMENTS Net periodic beneï¬t cost for the three years ended May 31 were as follows (in millions): Pension Plans 2011 2010 2009 2011 Postretirement Healthcare Plans 2010 2009 Service cost Interest cost Expected return on plan assets Recognized actuarial losses (... -
Page 62
...) FedEx Ground Segment > FedEx Ground (small-package ground delivery) > FedEx SmartPost (small-parcel consolidator) > FedEx Freight (LTL freight transportation) > FedEx Custom Critical (time-critical transportation) FedEx Services Segment > FedEx Services (sales, marketing and information technology... -
Page 63
...totals for the years ended or as of May 31 (in millions): FedEx Express Segment(1) FedEx Ground Segment FedEx Freight Segment(2) FedEx Services Segment(3) Other and Eliminations Consolidated Total Revenues 2011 2010 2009 Depreciation and amortization 2011 2010 2009 Operating income (loss) 2011 2010... -
Page 64
... INFORMATION Cash paid for interest expense and income taxes for the years ended May 31 was as follows (in millions): 2011 2010 2009 Revenue by Service Type FedEx Express segment: Package: U.S. overnight box U.S. overnight envelope U.S. deferred Total domestic package revenue International Priority... -
Page 65
... CONSOLIDATED FINANCIAL STATEMENTS NOTE 16: COMMITMENTS Annual purchase commitments under various contracts as of May 31, 2011 were as follows (in millions): Aircraft and Aircraft Related Facilities and Other(1) Total NOTE 17: CONTINGENCIES WAGE-AND-HOUR. We are a defendant in a number of lawsuits... -
Page 66
... lawsuits and state tax and other administrative proceedings that claim that the company's owner-operators should be treated as employees, rather than independent contractors. Most of the class-action lawsuits were consolidated for administration of the pre-trial proceedings by a single federal... -
Page 67
...A federal court in California ruled in April 2011 that paystubs for certain FedEx Express employees in California did not meet that state's requirements to reï¬,ect pay period begin date, total overtime hours worked and the correct overtime wage rate. The ruling came in a class action lawsuit ï¬led... -
Page 68
... NOTE 20: CONDENSED CONSOLIDATING FINANCIAL STATEMENTS We are required to present condensed consolidating ï¬nancial information in order for the subsidiary guarantors (other than FedEx Express) of our public debt to continue to be exempt from reporting under the Securities Exchange Act of 1934... -
Page 69
... and equipment Intercompany Receivable Goodwill Investment in Subsidiaries Other Assets Liabilities and Stockholders' Investment Current Liabilities Current portion of long-term debt Accrued salaries and employee beneï¬ts Accounts payable Accrued expenses Total current liabilities $ 250 36 8 47... -
Page 70
... taxes Net Income 1,452 (88) 104 (16) 1,452 - $ 1,452 CONDENSED CONSOLIDATING STATEMENTS OF INCOME Year Ended May 31, 2010 Parent Guarantor Subsidiaries Non-guarantor Subsidiaries Eliminations Consolidated Revenues Operating Expenses: Salaries and employee beneï¬ts Purchased transportation... -
Page 71
... CONDENSED CONSOLIDATING STATEMENTS OF INCOME Year Ended May 31, 2009 Parent Guarantor Subsidiaries Non-guarantor Subsidiaries Eliminations Consolidated Revenues Operating Expenses: Salaries and employee beneï¬ts Purchased transportation Rentals and landing fees Depreciation and amortization Fuel... -
Page 72
... Excess tax beneï¬t on the exercise of stock options Dividends paid Other, net Cash used in ï¬nancing activities Effect of exchange rate changes on cash Net (decrease) increase in cash and cash equivalents Cash and cash equivalents at beginning of period Cash and cash equivalents at end of period... -
Page 73
... FINANCIAL STATEMENTS CONDENSED CONSOLIDATING STATEMENTS OF CASH FLOWS Year Ended May 31, 2009 Parent Guarantor Subsidiaries Non-guarantor Subsidiaries Eliminations Consolidated Cash provided by (used in) operating activities Investing activities Capital expenditures Proceeds from asset... -
Page 74
REPORT OF INDEPENDENT REGISTERED PUBLIC ACCOUNTING FIRM The Board of Directors and Stockholders FedEx Corporation We have audited the accompanying consolidated balance sheets of FedEx Corporation as of May 31, 2011 and 2010, and the related consolidated statements of income, changes in stockholders'... -
Page 75
... years ended May 31, 2011. This information should be read in conjunction with the Consolidated Financial Statements, MD&A and other ï¬nancial data appearing elsewhere in this Annual Report. 2011(1) 2010 2009(2) 2008(3) 2007(4) Operating Results Revenues Operating income Income before income taxes... -
Page 76
...Chairman and President Barksdale Management Corporation Investment management company John A. Edwardson (1*) Professor University of Maryland School of Public Policy Former U.S. Trade Representative Chairman and Chief Executive Ofï¬cer CDW LLC Technology products and services company Frederick... -
Page 77
... President and Chief Operating Ofï¬cer FedEx Ground Cathy D. Ross Executive Vice President and Chief Financial Ofï¬cer FedEx Express Ward B. Strang President and Chief Executive Ofï¬cer FedEx SmartPost Manfred Schardt President and Chief Executive Ofï¬cer FedEx Trade Networks FedEx Services... -
Page 78
...stock is listed on the New York Stock Exchange under the ticker symbol FDX. SHAREOWNERS: As of July 11, 2011, there were 14,370 shareowners of record. MARKET INFORMATION: Following are high and low sale prices and cash dividends paid, by quarter, for FedEx Corporation's common stock in 2011 and 2010... -
Page 79
...ï¬,uence. Today global trade is the world's largest economy. Increasing growth, prosperity and well being. Energized by one force at the center of it all-FedEx. One brand with unique global perspectives. Dynamic solutions, innovations, people. The strongest networks in the industry. This is the de... -
Page 80
FEDEX CORPORATION 942 South Shady Grove Road Memphis, Tennessee 38120 fedex.com