Federal Express 2011 Annual Report Download - page 16
Download and view the complete annual report
Please find page 16 of the 2011 Federal Express annual report below. You can navigate through the pages in the report by either clicking on the pages listed below, or by using the keyword search tool below to find specific information within the annual report.-
 1
1 -
2
-
3
-
4
-
5
-
 6
6 -
 7
7 -
 8
8 -
 9
9 -
 10
10 -
 11
11 -
 12
12 -
 13
13 -
 14
14 -
 15
15 -
 16
16 -
 17
17 -
 18
18 -
 19
19 -
 20
20 -
 21
21 -
 22
22 -
 23
23 -
 24
24 -
 25
25 -
 26
26 -
27
-
28
-
29
-
30
-
31
-
32
-
33
-
34
-
35
-
36
-
37
-
38
-
39
-
40
-
41
-
42
-
43
-
44
-
45
-
46
-
47
-
48
-
49
-
50
-
51
-
52
-
53
-
54
-
55
-
56
-
57
-
58
-
59
-
60
-
61
-
62
-
63
-
64
-
65
-
66
-
67
-
68
-
69
-
70
-
71
-
72
-
73
-
74
-
75
-
76
-
77
-
78
-
79
-
80
 |
 |

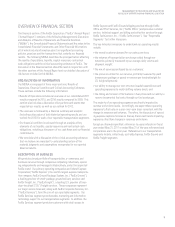
14
MANAGEMENT’S DISCUSSION AND ANALYSIS
Salaries and employee benefits increased 9% in 2011 due to the rein-
statement of merit salary increases, increases in pension and medical
costs and the reinstatement of full 401(k) company–matching contribu-
tions effective January 1, 2011. Purchased transportation increased
20% in 2011 due to volume growth, higher fuel surcharges and higher
rates paid to our independent contractors at FedEx Ground, as well as
costs associated with the expansion of our freight forwarding business
at FedEx Trade Networks. Maintenance and repairs expense increased
15% in 2011 primarily due to an increase in maintenance events, as a
result of timing, and higher utilization of our fleet driven by increased
volumes. Other operating expense increased 10% primarily due to
volume– and weather–related expenses.
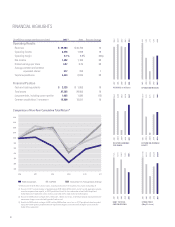
The following graph for our transportation segments shows our aver-
age cost of jet and vehicle fuel per gallon for the years ended May 31:
Fuel expense increased 34% during 2011 primarily due to increases
in the average price per gallon of fuel and fuel consumption driven
by volume increases. Based on a static analysis of the net impact of
year–over–year changes in fuel prices compared to year–over–year
changes in fuel surcharges, fuel had a positive impact on operating
income in 2011, predominantly at FedEx Express.
Our analysis considers the estimated impact of the reduction in fuel
surcharges included in the base rates charged for FedEx Express and
FedEx Ground services. However, this analysis does not consider the
negative effects that fuel surcharge levels may have on our business,
including reduced demand and shifts by our customers to lower–
yielding services. While fluctuations in fuel surcharge rates can be
significant from period to period, fuel surcharges represent one of the
many individual components of our pricing structure that impact our
overall revenue and yield. Additional components include the mix of
services sold, the base price and extra service charges we obtain for
these services and the level of pricing discounts offered. In order to
provide information about the impact of fuel surcharges on the trends
in revenue and yield growth, we have included the comparative fuel
surcharge rates in effect for 2011, 2010 and 2009 in the accompanying
discussions of each of our transportation segments.
Operating income and operating margin increased in 2010 primar-
ily as a result of the inclusion in 2009 of the impairment and other
charges described above. Volume increases at our package businesses,
particularly in higher–margin IP package and freight services at FedEx
Express, also benefited our 2010 results. Additionally, we benefited
in 2010 from several actions implemented in 2009 to lower our cost
structure, including reducing base salaries, optimizing our networks by
adjusting routes and equipment types, permanently and temporarily
idling certain equipment and consolidating facilities; however, these
benefits were partially offset by increased costs in 2010 associated
with our variable incentive compensation programs. An operating loss
at the FedEx Freight segment due to continued weakness in the LTL
freight market constrained the earnings increase.
Maintenance and repairs expense decreased 10% in 2010 primarily
due to the timing of maintenance events. Other operating expense
decreased 6% in 2010 due to actions to control spending and the inclu-
sion in the prior year of higher self–insurance reserve requirements at
FedEx Ground. Purchased transportation costs increased 4% in 2010
due to increased utilization of third–party transportation providers
associated primarily with our LTL freight service as a result of higher
shipment volumes.
Fuel expense decreased 18% during 2010 primarily due to decreases
in the average price per gallon of fuel and fuel consumption, as we
lowered flight hours and improved route efficiencies. Based on a static
analysis of the net impact of year–over–year changes in fuel prices
compared to year–over–year changes in fuel surcharges, fuel had a
significant negative impact to operating income in 2010.
Other Income and Expense
Interest expense increased $7 million during 2011 primarily due to
a decrease in capitalized interest related to the timing of construc-
tion projects and progress payments on aircraft purchases. Interest
expense decreased $6 million during 2010 due to increased capitalized
interest primarily related to progress payments on aircraft purchases.
Interest income decreased $18 million during 2010 primarily due to
lower interest rates and invested balances. Other expense increased
$22 million during 2010 primarily due to higher amortization of financ-
ing fees and foreign currency losses.
Income Taxes
Our effective tax rate was 35.9% in 2011, 37.5% in 2010 and 85.6%
in 2009. Our 2011 rate was lower than our 2010 rate primarily due to
increased permanently reinvested foreign earnings and a lower state
tax rate driven principally by favorable audit and legislative develop-
ments. In 2011, our permanent reinvestment strategy with respect to
unremitted earnings of our foreign subsidiaries provided a 1.3% benefit
to our effective tax rate. Our total permanently reinvested foreign
earnings were $640 million at the end of 2011 and $325 million at the
end of 2010. Our 2009 rate was significantly impacted by goodwill
impairment charges that were not deductible for income tax purposes.
Our current federal income tax expenses in 2011, 2010, and 2009
were significantly reduced by accelerated depreciation deductions
we claimed under provisions of the Tax Relief and the Small Business
Jobs Acts of 2010, the American Recovery and Reinvestment Tax Act
of 2009, and the Economic Stimulus Act of 2008. Those acts, designed
to stimulate new business investment in the U.S., accelerated our
depreciation deductions for new qualifying investments, such as our
Vehicle Jet
$1.75
$2.25
$2.75
$3.25
$3.75
2011201020092008
$3.25
$2.69
$3.04
$3.31
$2.66
$2.15
$2.62
$2.77
Average Fuel Cost per Gallon