GE 2008 Annual Report Download - page 17
Download and view the complete annual report
Please find page 17 of the 2008 GE annual report below. You can navigate through the pages in the report by either clicking on the pages listed below, or by using the keyword search tool below to find specific information within the annual report.-
 1
1 -
2
-
3
-
4
-
5
-
6
-
 7
7 -
 8
8 -
 9
9 -
 10
10 -
 11
11 -
 12
12 -
 13
13 -
 14
14 -
 15
15 -
 16
16 -
 17
17 -
 18
18 -
 19
19 -
 20
20 -
 21
21 -
 22
22 -
 23
23 -
 24
24 -
 25
25 -
 26
26 -
 27
27 -
28
-
29
-
30
-
31
-
32
-
33
-
34
-
35
-
36
-
37
-
38
-
39
-
40
-
41
-
42
-
43
-
44
-
45
-
46
-
47
-
48
-
49
-
50
-
51
-
52
-
53
-
54
-
55
-
56
-
57
-
58
-
59
-
60
-
61
-
62
-
63
-
64
-
65
-
66
-
67
-
68
-
69
-
70
-
71
-
72
-
73
-
74
-
75
-
76
-
77
-
78
-
79
-
80
-
81
-
82
-
83
-
84
-
85
-
86
-
87
-
88
-
89
-
90
-
91
-
92
-
93
-
94
-
95
-
96
-
97
-
98
-
99
-
100
-
101
-
102
-
103
-
104
-
105
-
106
-
107
-
108
-
109
-
110
-
111
-
112
 |
 |

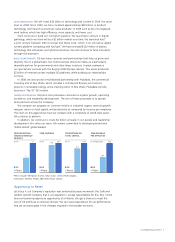
the third best earnings year in GE’s history. At the same time,
however, our 2008 earnings from continuing operations
were down 19% compared to 2007. To align compensation with
our financial performance, we reduced the size of our 2008
average bonus awards by 19% from 2007.
GE Earnings Versus S&P 500 Earnings
Increase (decrease) in earnings from 2007
GE Consolidated
(1) (19)%
S&P 500
(2) (30)%
GE Industrial Businesses
(3) 5%
S&P 500 Industrial Sector
(2) (0)%
GE Financial Businesses
(4) (37)%
S&P 500 Financial Sector
(2) (170)%
(1) Represents earnings from continuing operations.
(2) Represents operating earnings as reported by Standard & Poor’s. 2008 earnings
are based upon companies that have reported as of February 2, 2009.
(3) Consists of GE Energy Infrastructure, GE Technology Infrastructure,
NBC Universal and Consumer & Industrial.
(4) Represents GE Capital Services.
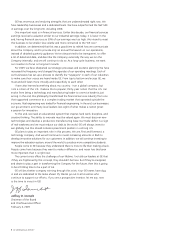
Leadership in the Challenging Times that Lie Ahead
In the midst of this recession, we look to our extremely capable
and well-trained managers to keep GE safe and focused on
long-term shareowner value creation. The Board holds our leaders
to an extremely high standard — we expect them to manage
their businesses with a sense of ownership that is informed both
by their deep operational expertise and a broad understanding
of how industry dynamics and global economic conditions will
affect their businesses now and into the future.
These may be unprecedented times, but we are confident that
GE has a capable, well-trained group of leaders that will secure
the long-term health, growth, and profitability of the company. In
the challenging times ahead, growing and retaining strong leaders
and rewarding them appropriately for disciplined and thoughtful
management will remain strategic imperatives for GE.
Sincerely,
Ralph S. Larsen
Chairman, Management Development
and Compensation Committee
February 6, 2009
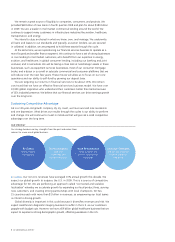
Sustain operating excellence and financial discipline
Þ "DIJFWFESFDPSESFWFOVFTJOBOEUIJSEMBSHFTUFBSOJOHT
total in GE’s history
Þ .BOBHFEUIF$PNQBOZUISPVHIUIFDVSSFOUFDPOPNJDUVSNPJM
in a safe and responsible way
Þ 4JHOJôDBOUMZTUSFOHUIFOFEUIF$PNQBOZ×TMJRVJEJUZQPTJUJPO
Þ 3FEVDFE(&$BQJUBM×TMFWFSBHFBOEJUTSFMJBODFPODPNNFSDJBM
paper debt and diversified its funding sources
Create a more valuable portfolio of businesses
Þ 3FPSHBOJ[FE(&$BQJUBMJOUFOEJOHUPNBJOUBJOJUTDPNQFUJUJWFOFTT
as a smaller, more focused finance company
Drive organic revenue growth at 2 to 3 times gross
domestic product
Þ (FOFSBUFEJOEVTUSJBMPSHBOJDSFWFOVFTHSPXUI
Retain an excellent team with a strong culture
Þ .BOBHFELFZMFBEFSTIJQUSBOTJUJPOTBU)FBMUIDBSF"WJBUJPO
and GE Money
Manage the Company’s risk and reputation
Þ -FETVDDFTTGVMTQPOTPSTIJQBOECSPBEDBTUPGUIF
Beijing 2008 Olympic Games
Build an excellent investor base
Þ "UUSBDUFELFZWBMVFJOWFTUPSTJOFRVJUZPGGFSJOH
Lead the Board activities
Þ $POUJOVFEUPTUSFOHUIFO#PBSENFNCFSTIJQ
STRATEGIC & OPERATIONAL GOALS
FINANCIAL OBJECTIVES
Change From
(Continuing operations) Goal Performance Prior Year
Revenues (In $ billions) 190 – 195 183 6%
Earnings (In $ billions) 24.2+ 18.1 (19)%
EPS ($ per share) 2.42+ 1.78 (19)%
CFOA (In $ billions) 23 – 26 19.1 (18)%
ROTC (%) ~20 14.8 (410) bp
Margins (%) ~17 15.6 (100) bp
2008 CEO Goals & Objectives
ge 2008 annual report 15