GE 2008 Annual Report Download - page 2
Download and view the complete annual report
Please find page 2 of the 2008 GE annual report below. You can navigate through the pages in the report by either clicking on the pages listed below, or by using the keyword search tool below to find specific information within the annual report.-
 1
1 -
 2
2 -
 3
3 -
 4
4 -
 5
5 -
 6
6 -
 7
7 -
 8
8 -
 9
9 -
 10
10 -
 11
11 -
 12
12 -
 13
13 -
14
-
15
-
16
-
17
-
18
-
19
-
20
-
21
-
22
-
23
-
24
-
25
-
26
-
27
-
28
-
29
-
30
-
31
-
32
-
33
-
34
-
35
-
36
-
37
-
38
-
39
-
40
-
41
-
42
-
43
-
44
-
45
-
46
-
47
-
48
-
49
-
50
-
51
-
52
-
53
-
54
-
55
-
56
-
57
-
58
-
59
-
60
-
61
-
62
-
63
-
64
-
65
-
66
-
67
-
68
-
69
-
70
-
71
-
72
-
73
-
74
-
75
-
76
-
77
-
78
-
79
-
80
-
81
-
82
-
83
-
84
-
85
-
86
-
87
-
88
-
89
-
90
-
91
-
92
-
93
-
94
-
95
-
96
-
97
-
98
-
99
-
100
-
101
-
102
-
103
-
104
-
105
-
106
-
107
-
108
-
109
-
110
-
111
-
112
 |
 |

CONTENTS
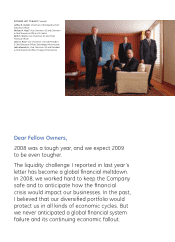
1 Letter to Investors
9 Business Overview
14 Governance
16 Board of Directors
17 Financial Section
108 Corporate Information
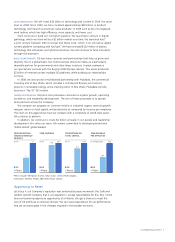
2008 Summary
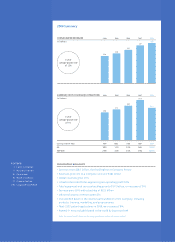
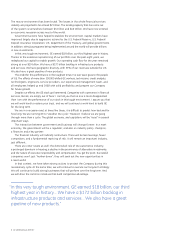
• Earnings were $18.1 billion, the third highest in Company history
• Revenues grew 6% to a Company record of $183 billion
• Global revenues grew 13%
• Infrastructure and Media segments grew operating profi t 10%
• Total equipment and services backlog grew to $172 billion, an increase of 9%
• Services grew 10% with a backlog of $121 billion
• Industrial organic revenues grew 8%
• Invested $15 billion in the intellectual foundation of the Company, including
products, training, marketing, and programming
• Filed 2,537 patent applications in 2008, an increase of 8%
• Named 4th most valuable brand in the world by BusinessWeek
Note: Financial results from continuing operations unless otherwise noted
2008 COMPANY HIGHLIGHTS
172
152
136
124
183
2004 2005 2006 2007 2008
CONSOLIDATED REVENUES
(In $ billions)
5-year
average growth rate
of 12%
22.5
19.3
17.3
15.6
18.1
2004 2005 2006 2007 2008
EARNINGS FROM CONTINUING OPERATIONS
(In $ billions)
Earnings Growth Rates 2004 2005 2006 2007 2008
GE 18% 11% 12% 16% (19%)
S&P 500 25% 10% 14% (7%) (30%)
5-year
average growth rate
of 7%