Google 2013 Annual Report Download - page 35
Download and view the complete annual report
Please find page 35 of the 2013 Google annual report below. You can navigate through the pages in the report by either clicking on the pages listed below, or by using the keyword search tool below to find specific information within the annual report.-
 1
1 -
2
-
3
-
4
-
5
-
6
-
7
-
8
-
9
-
10
-
11
-
12
-
13
-
14
-
15
-
16
-
17
-
18
-
19
-
20
-
21
-
22
-
23
-
24
-
 25
25 -
 26
26 -
 27
27 -
 28
28 -
 29
29 -
 30
30 -
 31
31 -
 32
32 -
 33
33 -
 34
34 -
 35
35 -
 36
36 -
 37
37 -
 38
38 -
 39
39 -
 40
40 -
 41
41 -
 42
42 -
 43
43 -
 44
44 -
 45
45 -
46
-
47
-
48
-
49
-
50
-
51
-
52
-
53
-
54
-
55
-
56
-
57
-
58
-
59
-
60
-
61
-
62
-
63
-
64
-
65
-
66
-
67
-
68
-
69
-
70
-
71
-
72
-
73
-
74
-
75
-
76
-
77
-
78
-
79
-
80
-
81
-
82
-
83
-
84
-
85
-
86
-
87
-
88
-
89
-
90
-
91
-
92
-
93
-
94
-
95
-
96
 |
 |

29
PART II
ITEM7.Management’sDiscussionandAnalysisofFinancialConditionandResultsofOperations
Costs and Expenses
Cost of Revenues
Costofrevenuesconsistsprimarilyoftracacquisitioncosts.TracacquisitioncostsconsistofamountspaidtoourGoogle
Network Members under AdSense arrangements and to certain other partners (our distribution partners) who distribute our
toolbar and other products (collectively referred to as access points) or otherwise direct search queries to our website (collectively
referredtoasdistributionarrangements).Theseamountsareprimarilybasedontherevenueshareandxedfeearrangements
withourGoogleNetworkMembersanddistributionpartners.
Certaindistributionarrangementsrequireustopayourpartnersbasedonafeeperaccesspointdeliveredandnotexclusively-
oratall-basedonrevenueshare.Thesefeesarenon-refundable.Further,thesearrangementsareterminableatwill,although
underthetermsofcertaincontractsweorourdistributionpartnersmaybesubjecttopenaltiesintheeventofearlytermination.
Werecognizefeesunderthesearrangementsovertheestimatedusefullivesoftheaccesspointstotheextentwecanreasonably
estimatethoselivesandtheyareoneyearorlonger,orbasedonanycontractualrevenueshare,ifgreater.Otherwise,thefees
arechargedtoexpenseasincurred.Theestimatedusefullifeoftheaccesspointsisbasedonthehistoricalaverageperiodof
timetheygeneratetracandrevenues.
Cost of revenues also includes the expenses associated with the operation of our data centers, including depreciation, labor, energy,
and bandwidth costs; hardware inventory costs; credit card and other transaction fees related to processing customer transactions;
amortizationofacquisition-relatedintangibleassets;andcontentacquisitioncosts.Wehaveenteredintoarrangementswith
certaincontentprovidersunderwhichwedistributeorlicensetheirvideoandothercontent.Inanumberofthesearrangements,
we display ads on the pages of our websites from which the content is viewed and share most of the fees these ads generate
withthecontentproviders.Wealsolicensecontentonthepagesofourwebsitesfromwhichthecontentissoldandsharemost
ofthefeesthesesalesgeneratewithcontentproviders.Totheextentweareobligatedtomakeguaranteedminimumrevenue
sharepaymentstoourcontentproviders,werecognizeascontentacquisitioncoststhecontractualrevenueshareamountor
theamountdeterminedonastraight-linebasis,whicheverisgreater,overthetermoftheagreements.
Inaddition,costofrevenuesincludesmanufacturingandinventory-relatedcostsprimarilyfromourMotorolaMobilesegment.
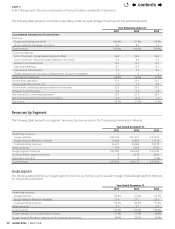
Thefollowingtablespresentourcostofrevenuesbyoperatingsegment,ourtracacquisitioncosts,andtracacquisitioncosts
as a percentage of advertising revenues in the Google segment, for the periods presented (dollars in millions):
Year Ended December31,
2011 2012 2013
Google $12,939 $16,816 $21,524
Motorola Mobile 0 3,294 3,773
Unallocated items 249 524 561
Total $13,188 $20,634 $25,858
Year Ended December31,
2011 2012 2013
TracacquisitioncostsrelatedtoAdSensearrangements $7,294 $ 8,791 $ 9,293
Tracacquisitioncostsrelatedtodistributionarrangements 1,517 2,165 2,965
Tracacquisitioncosts $8,811 $10,956 $12,258
TracacquisitioncostsasapercentageofGooglesegmentadvertisingrevenues 24.1% 25.1% 24.2%
CostofrevenuesfortheGooglesegmentincreased$4,708millionfrom2012to2013.Theincreasewasduetoincreasesintrac
acquisitioncostsof$1,302millionresultingfrommoredistributionfeespaid,morefeespaidforadditionaltracdirectedtoour
websites,aswellasmoreadvertiserfeesgeneratedthroughourAdSenseprogram.Theremainingincreasewasprimarilydriven
by an increase in data center costs, hardware inventory costs as a result of increased hardware sales, content acquisition costs
as a result of increased activities related to YouTube and digital content, and revenue share payments to mobile carriers and
originalequipmentmanufacturers(OEMs).Thedecreaseintracacquisitioncostsasapercentageofadvertisingrevenueswas
primarilyasaresultofashiftofmixbetweenGooglewebsiterevenueandGoogleNetworkMembers’websites.
contents